Preprocess Spectra
Construct a data preprocessing pipeline.
Inputs
- Data: required input data set
- Reference: optional reference data set used in some preprocessing methods
Outputs
- Preprocessed Data: transformed data set
- Preprocessor: preprocessing methods
The Preprocess Spectra widget applies a series of preprocessing methods to spectral data. You can select the preprocessing method from the list and press the triangle button on the right to visualize the result. The order of the preprocessing matters, so to change the order of the preprocessing, just drag and drop the method to its proper place.
The input data for the selected method is displayed in the top plot, while the preprocessed data is shown in the bottom plot.
You can observe each preprocessing step by pressing the triangle button on the right. To apply all of then and observe the final result plot, press Final preview. To output the data, press Commit.
The reference data set is processed along the input data: only the first preprocessor uses the reference as on the input. If the reference needs to stay fixed, split your preprocessing methods among multiple Preprocess Spectra widgets and connect references accordingly.
Below is an example of the Preprocess Spectra widget in action with some explanation of the main features.
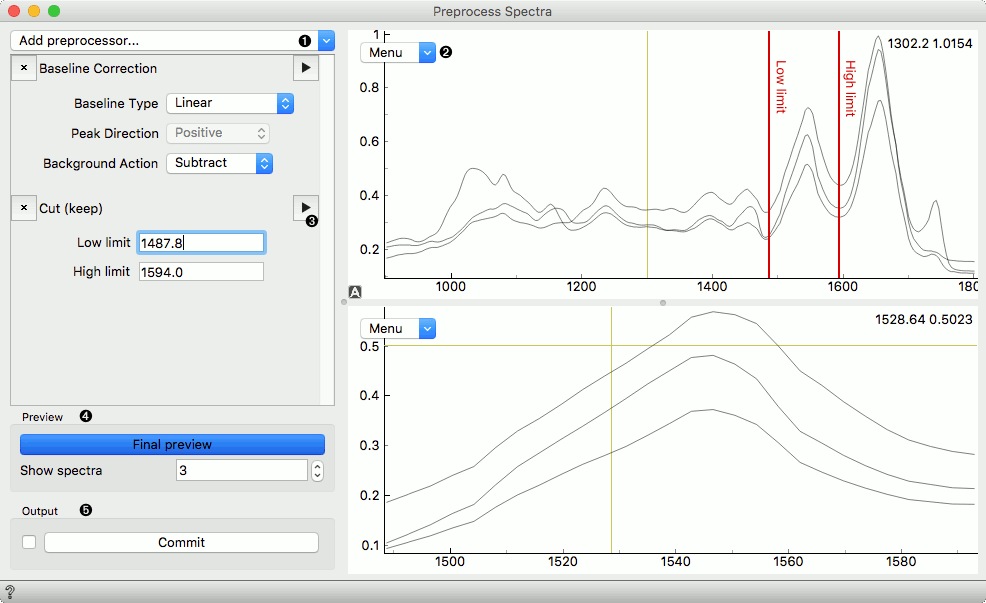
- Add a preprocessor from the dropdown menu.
- Preview plot with its editor menu like in the Spectra widget. The top plot shows the data before and the bottom after preprocessing.
- Preview a single preprocessor (the upper plot will show its input, the plot below its output).
- Observe the final result of preprocessing by clicking the Final Preview button. Change the number of spectra shown in the plot.
- Press Commit to calculate and output the preprocessed data.
Preprocessing Methods
- Cut: Select the cutoff value of the spectral area and whether you wish to keep or discard that area.
- Gaussian smoothing: apply Gaussian smoothing.
- Savitzky-Golay Filter: apply Savitzky-Golay filter.
- Baseline Correction: correct the baseline
- Normalize Spectra: apply normalization.
- Vector normalization: calculates the L2 norm
- Min-Max normalization: divides each spectra with its Ymax - Ymin range
- Area normalization: provides several methods, also allows the selection of a specific range for the calculation
- Attribute normalization: normalize each spectrum with one of the available pre-calculated attributes
- Standard Normal Variate (SNV): \(\tilde{X}^{SNV}_i = (X_i - \tilde{X}_i) / \sigma_i\)
- Normalize by Reference: divides each spectrum with the reference spectrum on the input
- Integrate: compute integrals of selected area. Similar to the Integrate Spectra widget.
- PCA denoising: denoise the data with PCA.
- Transmittance to Absorbance: convert from transmittance to absorbance spectra.
- Absorbance to Transmittance: convert absorbance spectra to transmittance.
- Shift spectra: shift things around.
- EMSC: special Norweigan method.
- Spike Removal: Removes spikes in spectra through a modified z-score. More...
- Asymmetric Least Squares Smoothing: Three ALS methods which can be used for baseline subtraction. More...
- Atmospheric gas correction: remove H20/CO2 contributions using a reference spectrum. More...
Example
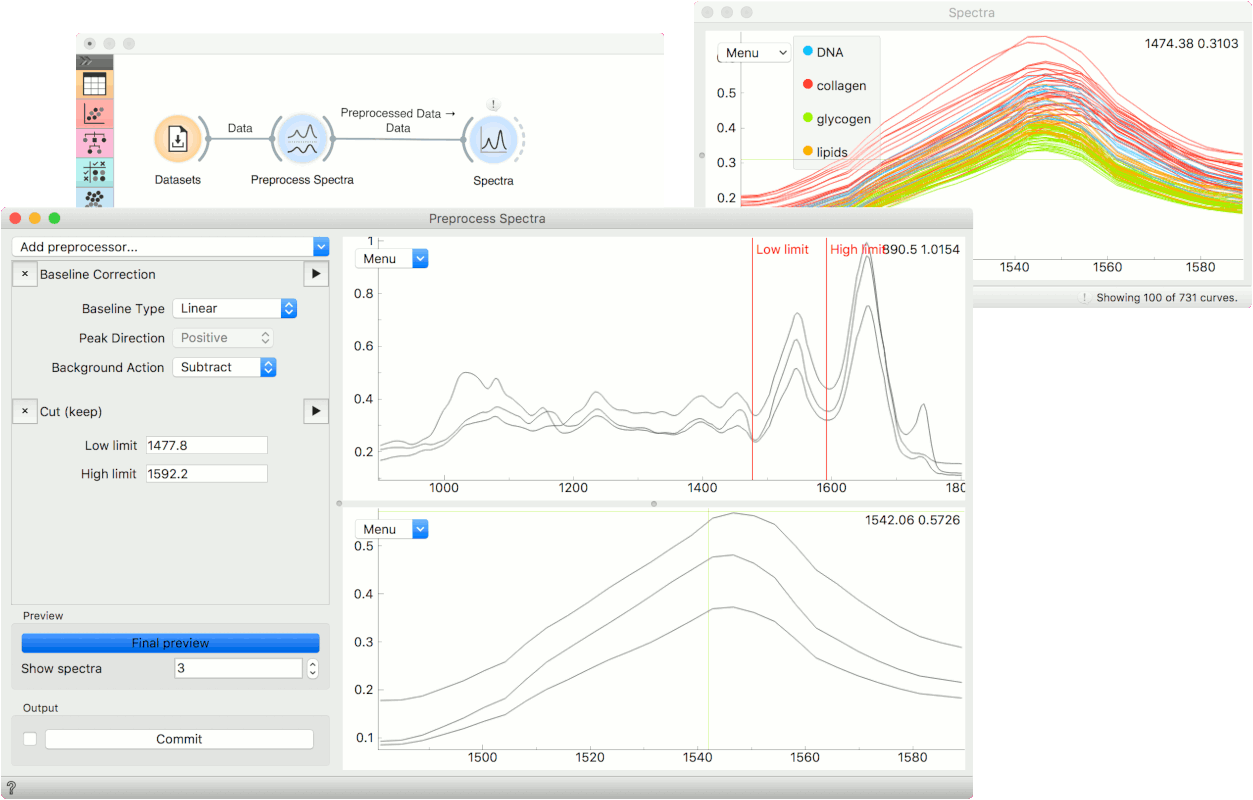
Normally, we would use Preprocess Spectra at the beginning of the analysis. We will use the liver spectroscopy data from the Datasets widget.
In Preprocess Spectra we will select a couple of preprocessing methods and observe their output. First, let us use the Baseline Correction which removes the baseline from the spectra.
Then we will cut an area of interest with the Cut (keep) method. To set the area we wish to keep, drag the red lines left or right in the plot. You will see how the bottom changes with a change in selection.
To see the end result of preprocessing, press Final preview and once you are satisfied with the results, press Commit. We can observe the end result in a Spectra widget or use the preprocessed data in the downstream analysis.