Spectra
Visually explore series of spectra with no spatial information.
Inputs
- Data: input dataset
- Data Subset:subset of the data
Outputs
- Selection: selected spectra
The Spectra widget allows visual exploration of multiple spectra. To output some spectra, select them by clicking. For multiple selection, hold the modifier key (Ctrl or Cmd) or use line selection (see the plot options menu). Selected spectra will appear dashed.
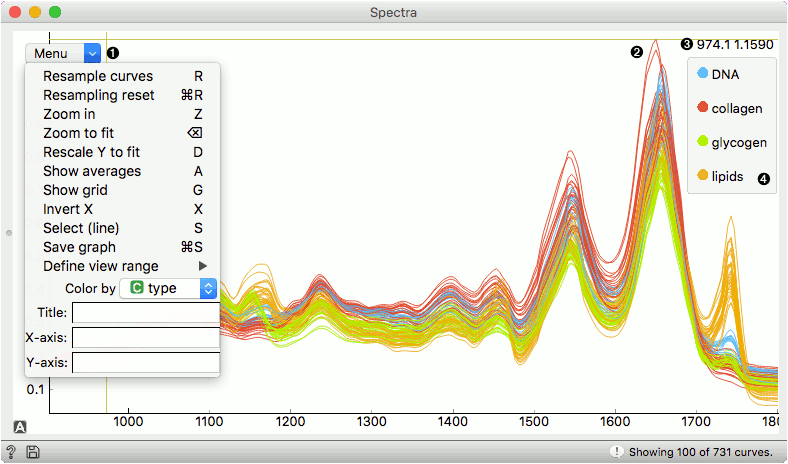
- Open the plot options menu
- A spectrum
- The X and Y position of the cursor
- The legend (appears only is spectra are colored)
Navigation
- Click + drag: move the plot
- Right-click: zoom to fit
- Right-click + drag: zoom with mouse movement
- Scroll: zoom X axis
- Scroll + modifier: zoom Y axis
Plot options
- Resample curves (R): resample the displayed a subset (only a subset is displayed for performance)
- Resampling reset (Mod + R): resample to the default view
- Zoom in (Z): zoom to a region (selected afterwards)
- Zoom to fit (Backspace): return to the original plot
- Rescale Y to fit (D): rescale the Y axis to fit the screen (useful if zoomed-in)
- Show averages (A): show the average and standard deviation (per group)
- Show grid (G): show the grid for a better inspection of the plot
- Invert X (X): invert the order of the X axis
- Add Peak Label (P) : Add an adjustable vertical line with label. Remove lines with a right click.
- Select (line) (S): select the spectra touching a line (draw a line with a mouse)
- Save graph (Mod + S): export the visualization to an imags
- Define view range: define a specific range to display
- Color by: a categorical feature for coloring
- Title, X-axis, Y-axis: annotate the plot
Example
The Spectra widget is used to visualize spectral data. X axis normally shows wavenumbers, while the Y axis shows the absorbance. We will plot the Liver spectroscopy data from the Datasets widget as an example.
We have used Color by option to display the type of each spectrum. Or you can also press 'C' and the plot will show colors. Colors are defined with the data; to change colors, use the Color widget.
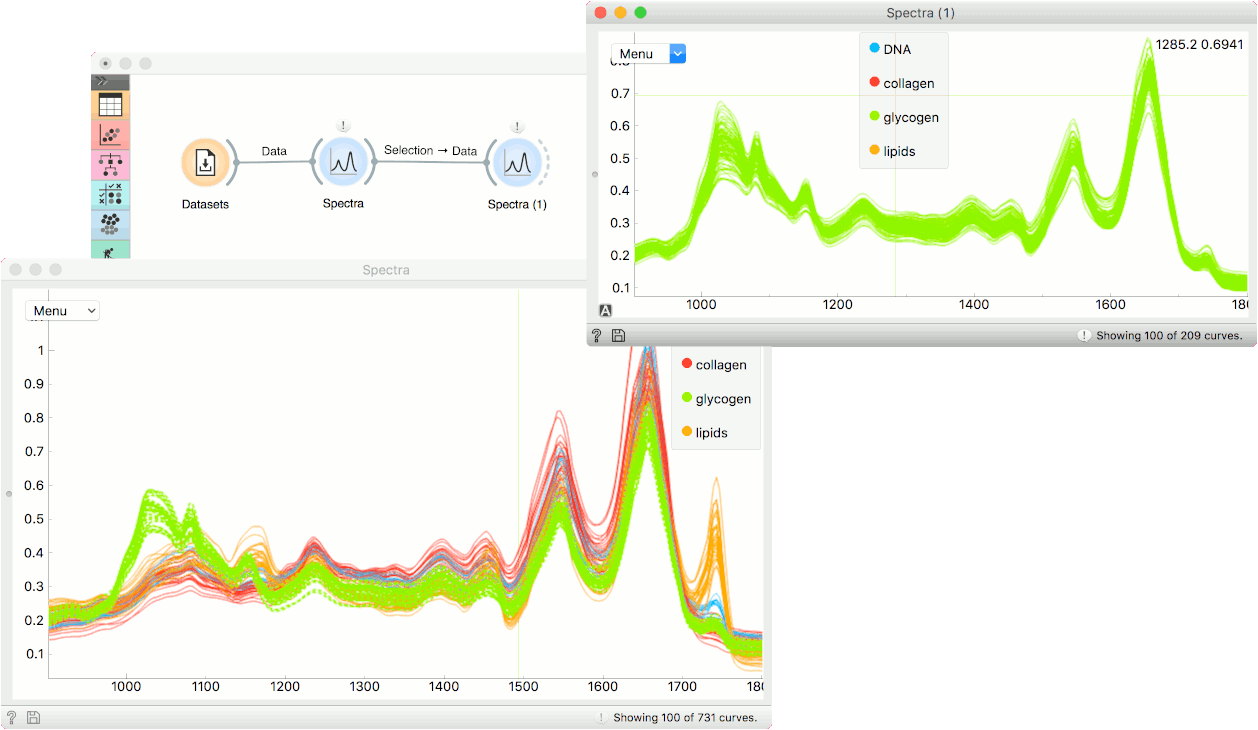
Now, let's say I am interested in those spectra, that are quite separated from the rest at wavenumber around 1027. I will press 'S' and drag a line. This will select the spectra under the line I have dragged.
I can observe the selection in another Spectra widget or use it for further analysis.