Integrate Spectra
Integrate spectra in various ways.
Inputs
- Data: input dataset
Outputs
- Integrated Data: data with integrals appended
- Preprocessor: preprocessing method
The Integrate Spectra widget allows you to add integrals to your data by selecting regions of interest and integrating them with several methods.
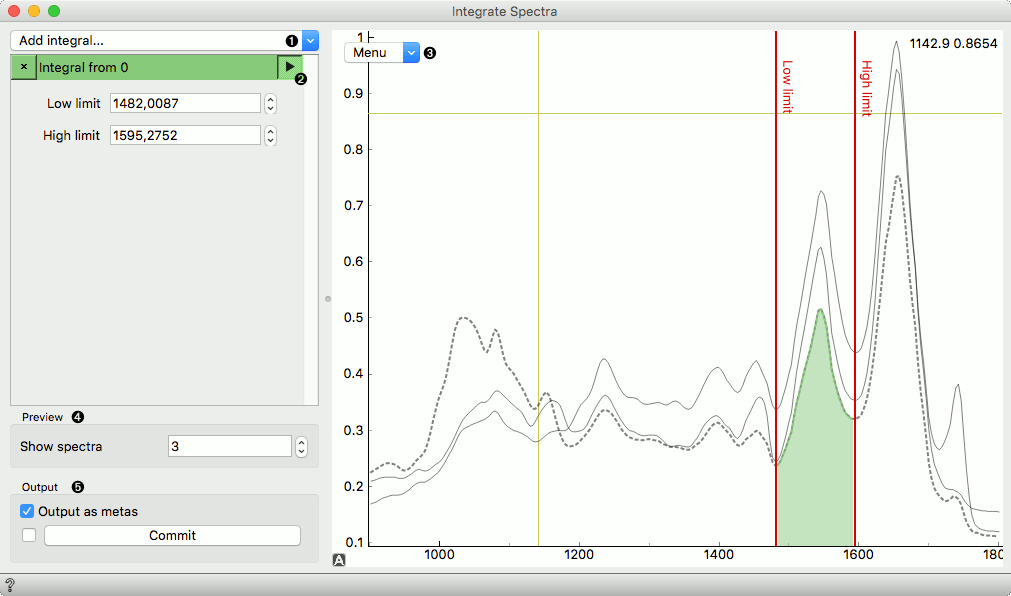
- Add integral:
- Integral from 0:
- The sum of the area under the curve above (+) and below (-) zero. The integral is calculated using the trapezoidal method.
- Integral from baseline:
- The sum of the area under the curve above (+) and below (-) a baseline defined as a straight line between the integral endpoints. The integral is calculated using the trapezoidal method.
- Absolute integral from baseline:
- The absolute value of the area under the curve above and below the baseline defined as a straight line through the integral endpoints.
- Peak from 0:
- Peak from baseline:
- Closest value:
- X-value of maximum from 0:
- X-value of maximum from baseline
- Integral from 0:
- Toggle preview.
- Preview plot with its editor menu like in the Spectra widget.
- Show a subsample of the spectra (implemented for performance).
- Output integrals as meta attributes. Otherwise only integrals will be output. Commit to send the changes to the output.
Example
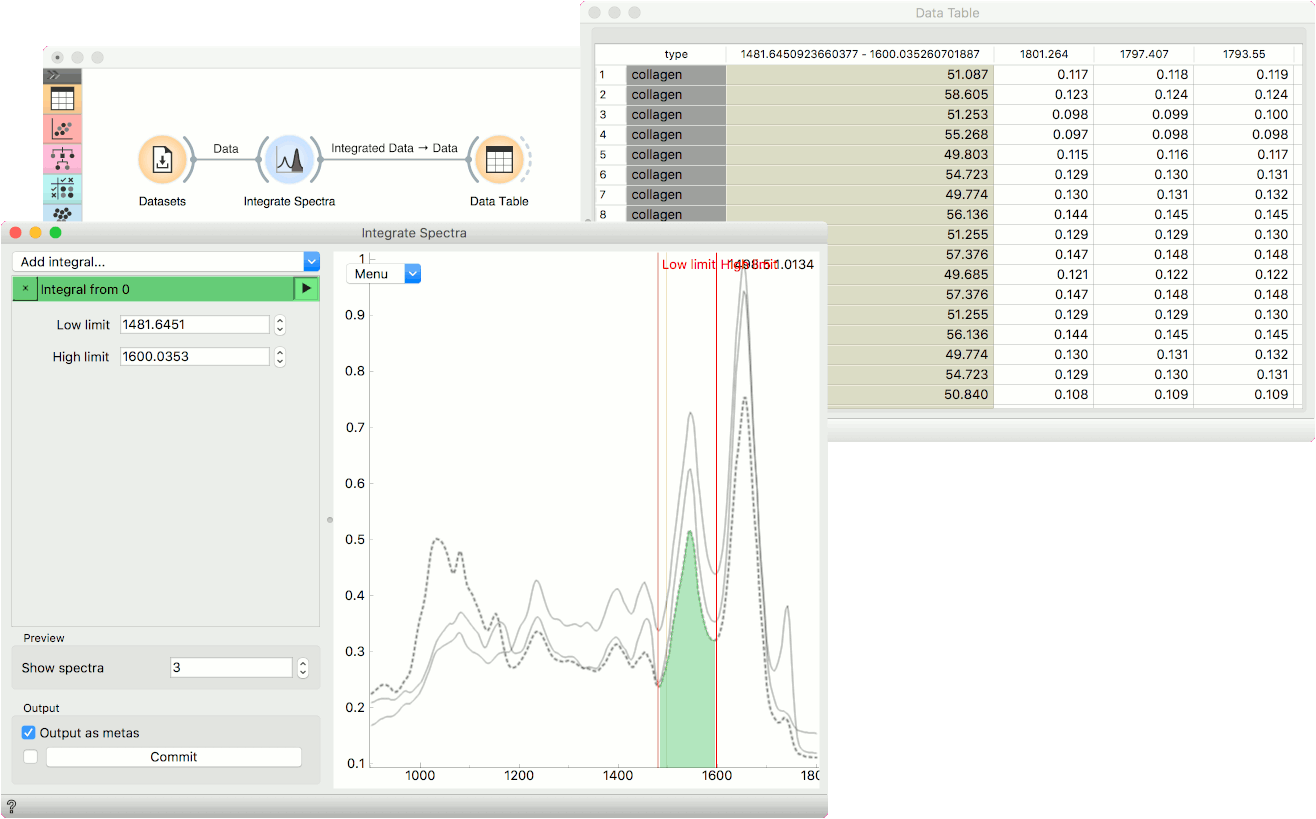
This is a simple example on how to use the Integrate Spectra widget. The widget provides many options for integrating spectral areas and the results are appended as additional columns to the data.
We are using the liver spectroscopy data set from the Datasets widget. In Integrate Spectra we have selected integral from 0 and set the lower and upper limit with the red lines. We could also do it by setting the Low limit and High limit values on the left.
To observe the integrated area, we need to press the triangular play button next to the method. To output the data, we need to press Commit.
Finally, we can observe the additional column with the integral values of the area in a Data Table.