HyperSpectra
Plots 2D map of hyperspectra.
Inputs
- Data: input dataset
Outputs
- Selection: spectra from selected area
- Data: dataset with information whether a spectrum was selected or not
The HyperSpectra widget plots hyperspectra that were read from the .map file. To use this widget with infrared spectral data, you need to transform it with Reshape Map widget.
At the top, HyperSpectra shows a 2D map of a slice of the spectra. At the bottom, a spectra plot is shown with the red line indicating the wavenumber slice we are observing at the top.
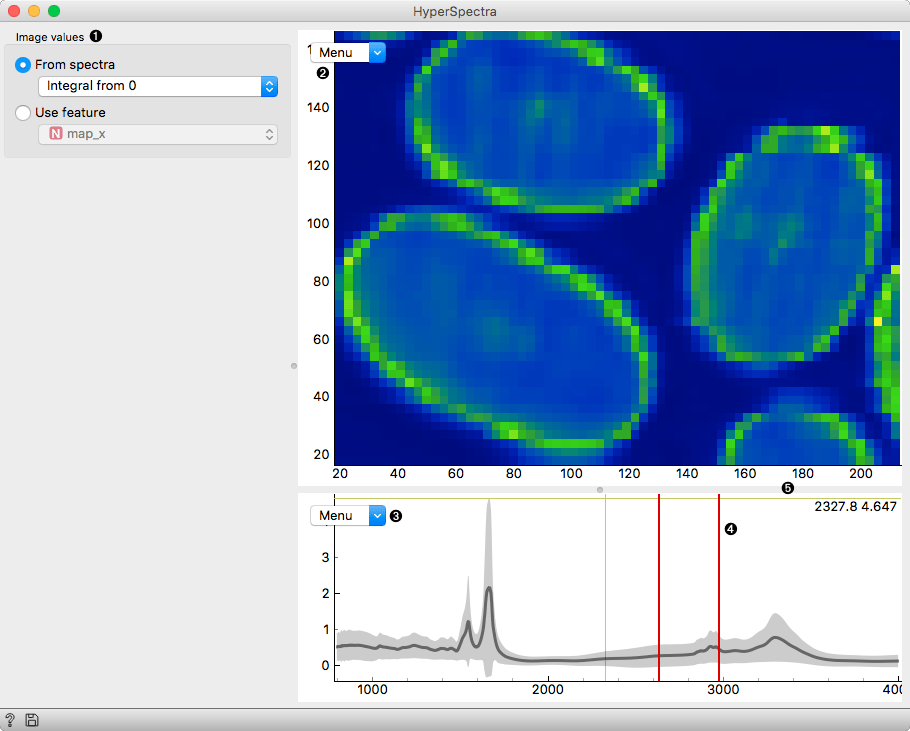
- Image values: define the transformation (usually an integral) of the spectra or use a feature to use as values for the plot. The former transformation can be an integral from 0, integral from baseline, peak from 0, peak from baseline, closest value, X-value of maximum from 0 or X-value of maximum from baseline.
- The hyperspectral plot of the slice of the spectra.
- Zoom in (Z): zoom in to the area selected from the hyperspectral plot
- Zoom to fit (backspace): return to the original plot
- Select (rectangle) (S): select a rectangular area
- Select (polygon) (P): select an area by circumscribing a polygon
- Save graph (Mod + S): save the visualization as a .png, .svg or .pdf file.
- Axis x: define the attribute for the x axis
- Axis y: define the attribute for the y axis
- Color: select the color for the plot
- The spectral plot of the selected image region. It behaves like the Spectra widget.
- Region selectors for the chosen integration method.
- Split between image and spectral view: move it to increase the image size.