Widgets
Data
-
File
-
CSV File Import
-
Datasets
-
SQL Table
-
Data Table
-
Paint Data
-
Data Info
-
Data Sampler
-
Select Columns
-
Select Rows
-
Pivot Table
-
Rank
-
Correlations
-
Merge Data
-
Concatenate
-
Select by Data Index
-
Transpose
-
Randomize
-
Preprocess
-
Apply Domain
-
Impute
-
Outliers
-
Edit Domain
-
Python Script
-
Create Instance
-
Color
-
Continuize
-
Create Class
-
Discretize
-
Feature Constructor
-
Feature Statistics
-
Neighbors
-
Purge Domain
-
Save Data
Visualize
Model
Evaluate
Unsupervised
Spectroscopy
Text Mining
-
Corpus
-
Import Documents
-
The Guardian
-
NY Times
-
Pubmed
-
Twitter
-
Wikipedia
-
Preprocess Text
-
Corpus to Network
-
Bag of Words
-
Document Embedding
-
Similarity Hashing
-
Sentiment Analysis
-
Tweet Profiler
-
Topic Modelling
-
Corpus Viewer
-
Word Cloud
-
Concordance
-
Document Map
-
Word Enrichment
-
Duplicate Detection
-
Statistics
Bioinformatics
Single Cell
Image Analytics
Networks
Geo
Educational
Time Series
Associate
Yahoo Finance
Generate time series from Yahoo Finance stock market data.
Outputs
- Time series: Time series table of open, high, low, close (OHLC) prices, volume and adjusted close price.
This widget fetches historical stock market data from Yahoo Finance and outputs it as a time series data table.
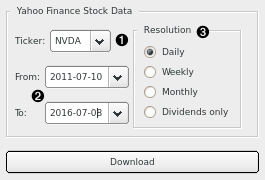
- Stock (e.g. GOOG) or index (e.g. DJI) symbol you are interested in.
- Date range you are interested in.
- Desired resolution of the time series. Can be one of: daily, weekly, monthly, or dividends. The last option outputs a table of dates when dividends were issued, along with their respective dividend amounts.
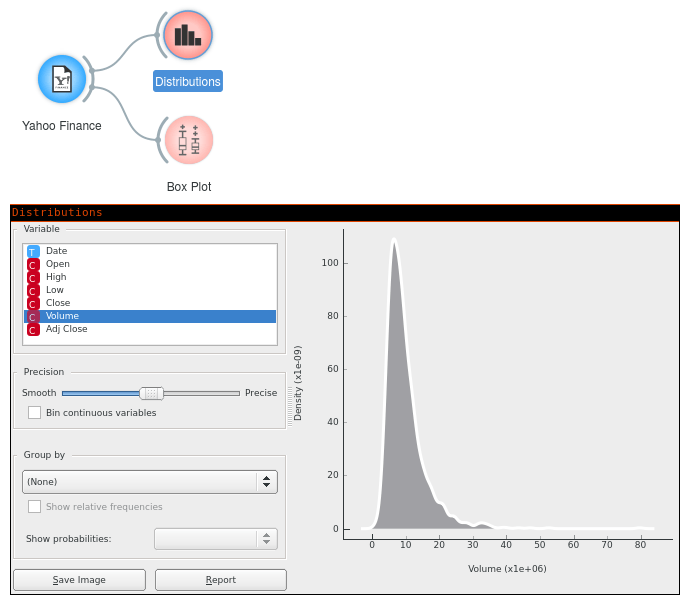
Example
Since the output data type is inherently a Table, you can connect it to wherever a data table is expected. Naturally, you can use it to test some functions in the Timeseries add-on.