Periodogram
Visualize time series' cycles, seasonality, periodicity, and most significant periods.
Inputs
- Time series: Time series from the File or as output by As Timeseries widget.
In this widget, you can visualize the most significant periods of the time series.
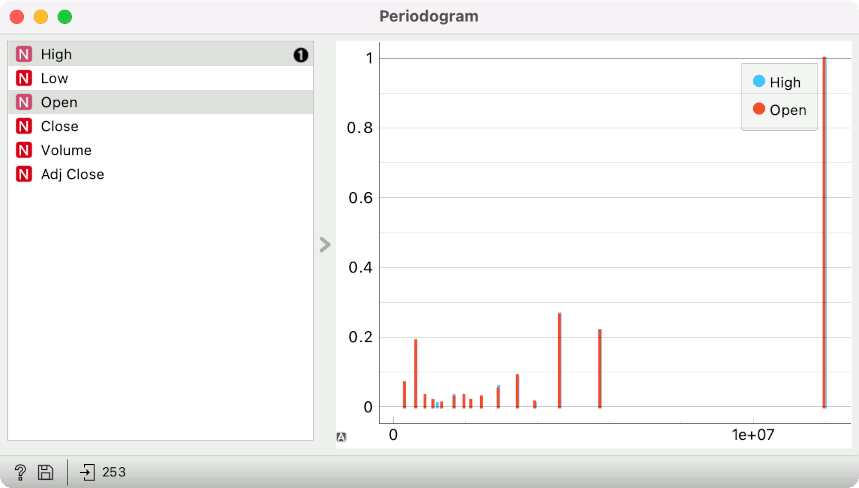
- Select the series to calculate the periodogram for.
Periodogram for non-equispaced series is calculated using Lomb-Scargle method.
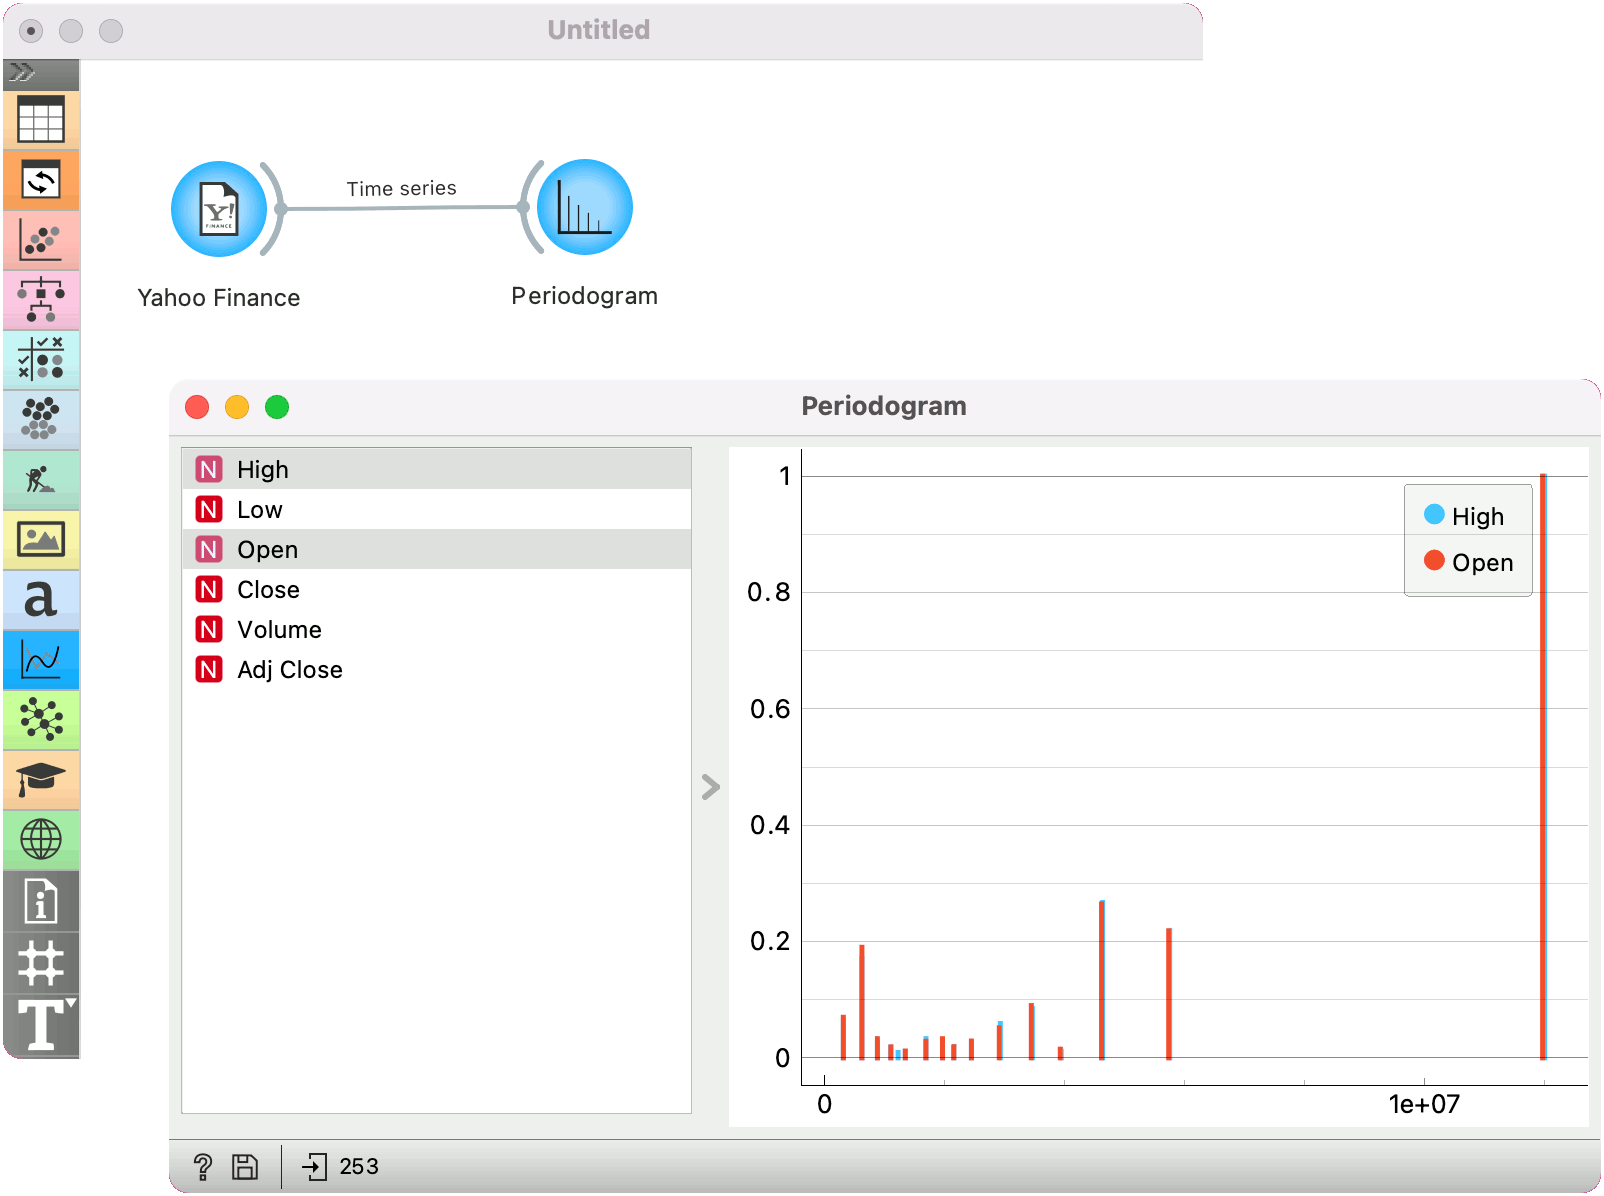
Example
Here is a simple example on how to use the Periodogram widget. We have passed the Yahoo Finance data to the widget and plotted the periodicity of Amazon stocks for the past 6 years.