Kaplan-Meier Plot
Visualisation of Kaplan-Meier estimator.
Inputs
- Data: reference survival dataset
Outputs
- Data: reference survival dataset with an additional column showing whether a point is selected
- Selected Data: instances selected from the plot
Kaplan-Meier Plot is a visual representation of the estimated survival function that shows the probability of an event at a respective time interval. It works on survival datasets, which by definition include time and event observations. We can select which features should serve as Time and Event variables manually using As Survival. The plot allows visualisation of the survival functions of different groups based on feature values. This can be selected on the left side of the widget, where we can also choose wheter to display confidence intervals, median and/or censored data instances. The plot enables interactive selection of data instances that are propagated down the workflow for potential further analysis. The method for Kaplan-Meier estimation is implemented in lifelines (the python package for survival analysis) by Davidson-Pilon (2019).
Example
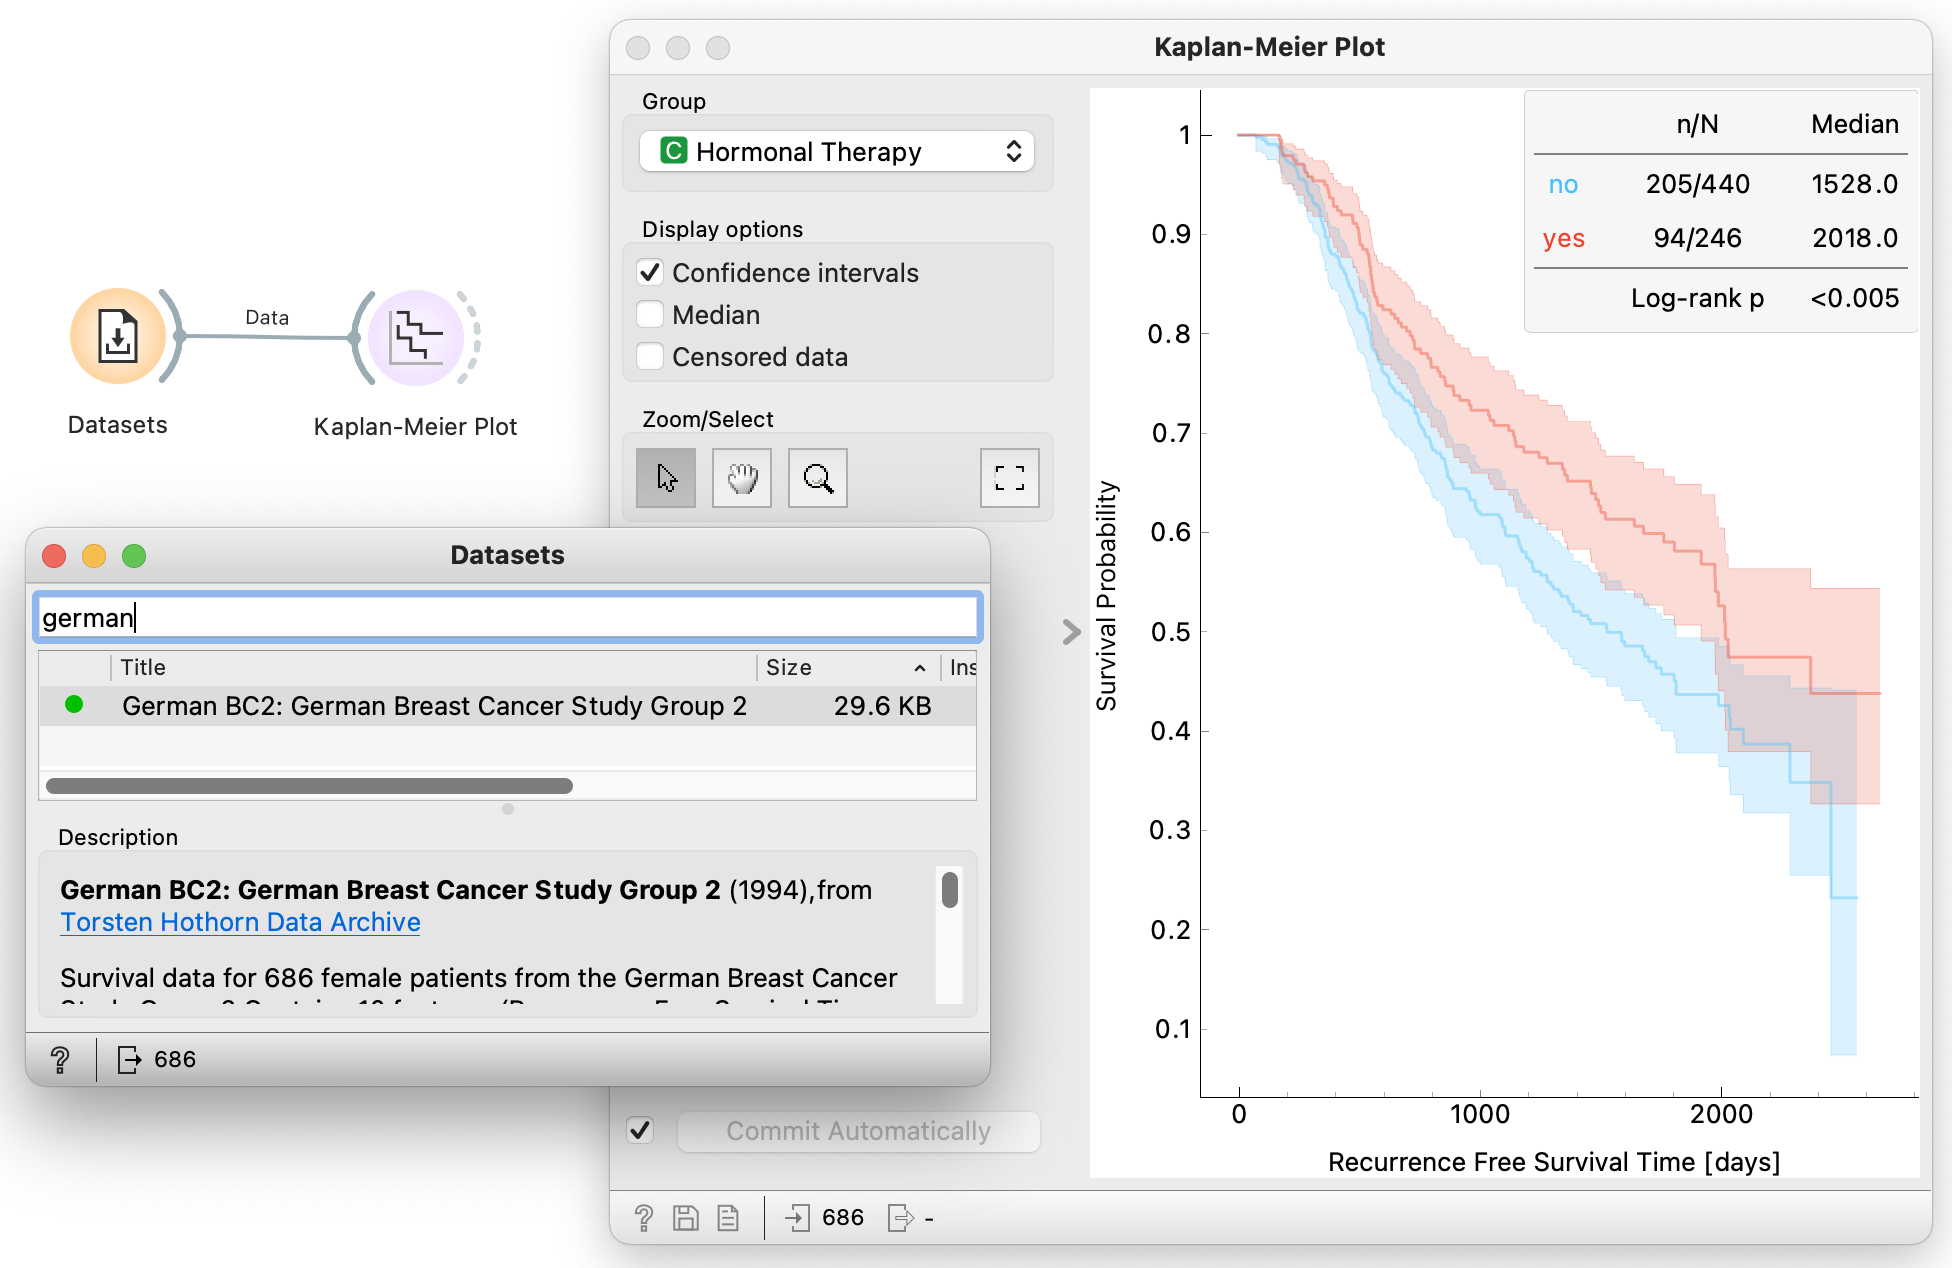
In this simple example we use the Kaplan-Meier Plot to visualize the survival function of the investigated population in the German breast cancer study group 2. We load the already available data with the use of Datasets and simply connect it to the Kaplan-Meier Plot. The use of As Survival, in this case, is not necessary, as there is only one Time/Event pair, and the dataset was pre-curated for use in survival widgets. The Kaplan-Meier Plot estimates and plots the survival function from the lifeline data provided at the input. On the left side of the widget we select to compare survival curves of groups based on wheter or not the patient recieved hormonal therapy and choose to display the confidence intervals.
References
Davidson-Pilon, (2019). lifelines: survival analysis in Python. Journal of Open Source Software, 4(40), 1317, https://doi.org/10.21105/joss.01317