4+ Angle Polarization
Calculates vibrational mode orientation from polarized infrared spectroscopy datasets
Inputs
- Data: input dataset(s)
Outputs
- Polar Data: dataset with selected feature(s) orientation information
- Curve Fit Model Data: dataset with the optimal parameters of the curve fit model
The 4+ Angle Polarization widget allows you to calculate orientation information of selected features using polarized spectroscopy data collected at 4 or more polarization angles. The implemented algorithm is the same as that outlined by Hikima et al. (2013)1
If you use this widget for your data analysis, please cite the articles in which the method (Hikima et al. (2013)1) and widget (Gassner et al. (2025)2) are introduced.
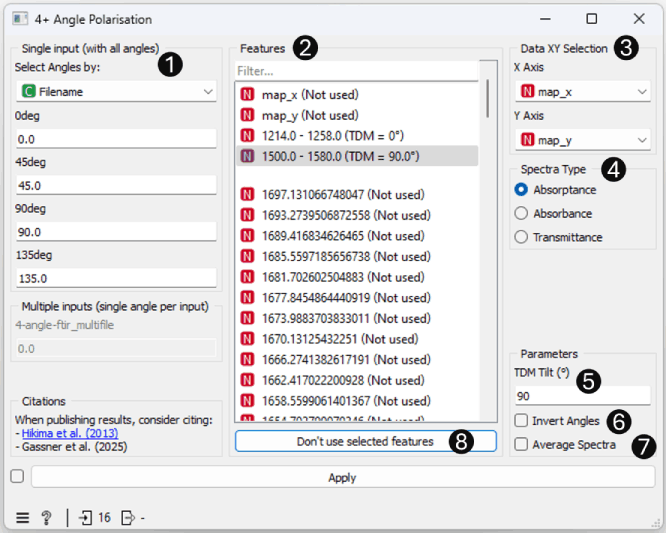
- Inputs: Define the polarization angles of the input dataset. Data can be passed to widget with two methods:
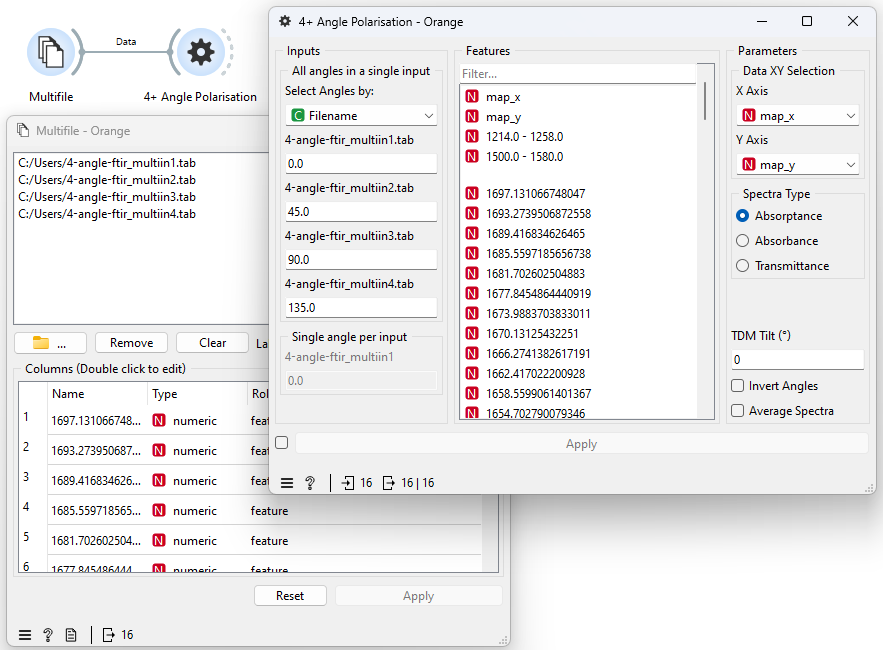
- Multifile Input: A single input with data from all polarization angles in a single dataset. (Each polarization angle must be separated with a categorical variable).
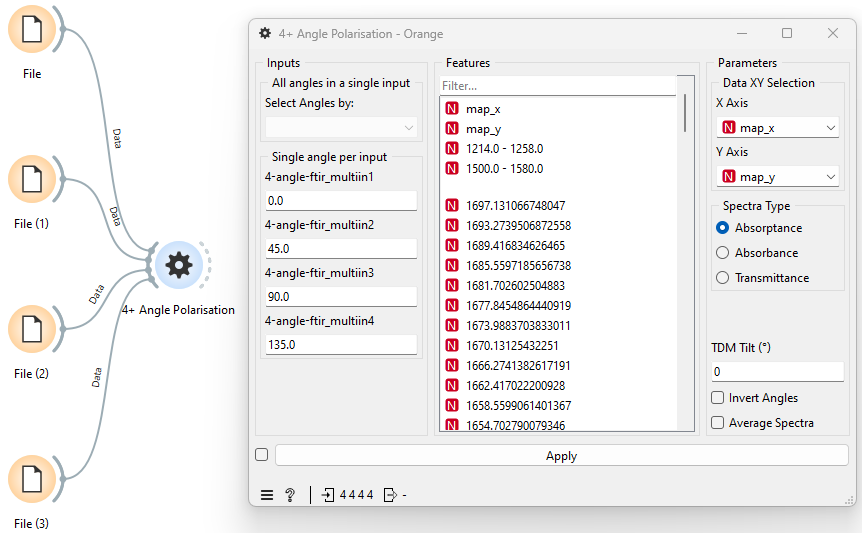
- Multiple Inputs: 1 input per polarization angle.
- Features: Select the features to calculate the orientation of. Features are selected by clicking on the desired feature(s) and assigning a TDM value (see point 5). A default value is assigned using the current value in the "TDM Tilt (°)" box, changing this value will change the associated value of the selected feature(s). Deselecting features will not remove them from the list to be calculated, only features with ("Not used") will not be calculated (see point 8).
- Data XY Selection: Define the attributes for the x and y axes for 2D datasets.
- Spectra Type: The type of spectra on the input. A conversion to Absorptance is performed before calculating orientation information when Absorbance or Transmittance is selected (this does not affect meta and class variables).
- TDM Tilt (°): The angle of the Transition Dipole Moment with respect to the molecular axis. Used in calculation of the value of Herman's orientation function.
- Invert Angles: Invert the calculated Azimuth Angles about the 0 degree axis (i.e. so that 90 degrees is output as -90 degrees).
- Average Spectra: Average all output variables across polarization angles.
- Don't use selected features: Remove the selected features from the list to be used in calculations
Input Examples
MultiFile Input
Multiple Inputs
Advanced
Unlike the majority of widgets, Polar uses multiple processes during fitting to improve
responsiveness and performance. By default this is limited to 2 extra processes, but this can be
overridden by setting the environment variable QUASAR_N_PROCESSES to the desired number, or all
to use the default value returned by os.cpu_count().
References
- Hikima, Y.; Morikawa, J.; Hashimoto, T., Wavenumber Dependence of FT-IR Image of Molecular Orientation in Banded Spherulites of Poly(3-hydroxybutyrate) and Poly(L-lactic acid). Macromolecules 2013, 46, 1582-1590.
- Gassner, C.; Vongsvivut, J.; Ryu, M.; Ng, S.H.; Toplak, M.; Vijayakumar, A.; Takkalkar, P.; Fac, M.L.; Sims, N.A.; Wood, B.R.; Tobin, M.J.; Juodkazis, S.; Morikawa, J., Bridging spectroscopy and advanced molecular orientation analysis with new 4+ angle polarization toolbox in Quasar. Computers in Biology and Medicine 2025, 196, 110573