Polynomial Regression
Educational widget that interactively shows regression line for different regressors.
Inputs
- Data: input data set. It needs at least two continuous attributes.
- Preprocessor: data preprocessors
- Learner: regression algorithm used in the widget. Default set to Linear Regression.
Outputs
- Learner: regression algorithm used in the widget
- Predictor: trained regressor
- Coefficients: regressor coefficients if any
Description
This widget interactively shows the regression line using any of the regressors from the Model module. In the widget, polynomial expansion can be set. Polynomial expansion is a regulation of the degree of the polynom that is used to transform the input data and has an effect on the shape of a curve. If polynomial expansion is set to 1 it means that untransformed data are used in the regression.
- Regressor name.
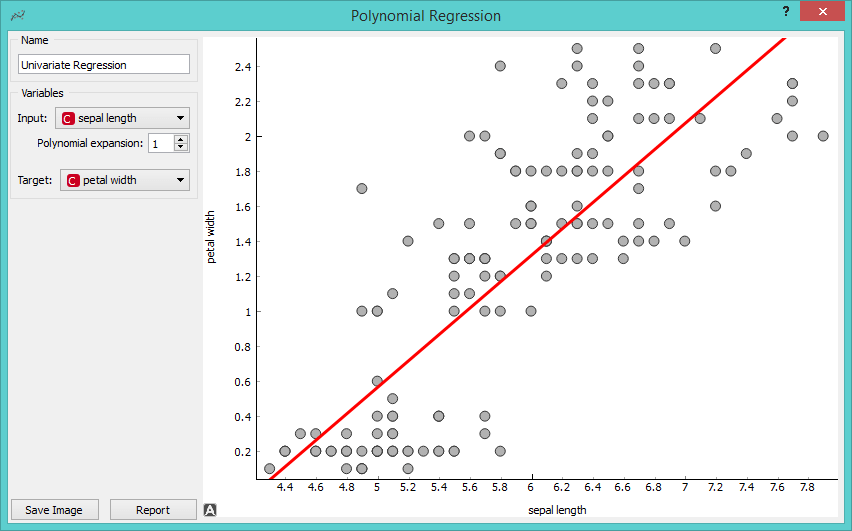
- Input: independent variable on axis x. Polynomial expansion: degree of polynomial expansion. Target: dependent variable on axis y.
- Save Image saves the image to the computer in a .svg or .png format. Report includes widget parameters and visualization in the report.
Example
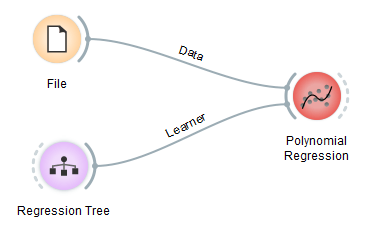
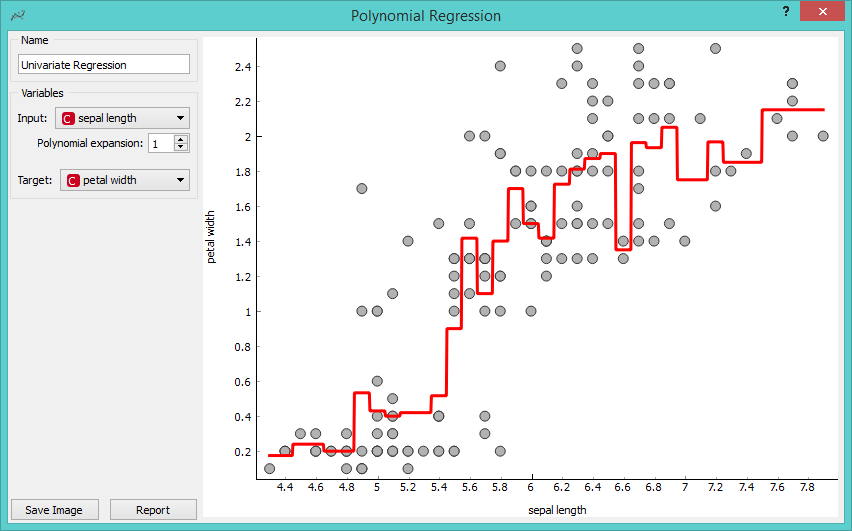
We loaded iris data set with the File widget. Then we connected Linear Regression learner to the Polynomial Regression widget. In the widget we selected petal length as our Input variable and petal width as our Target variable. We set Polynomial expansion to 1 which gives us a linear regression line. The result is shown in the figure below.
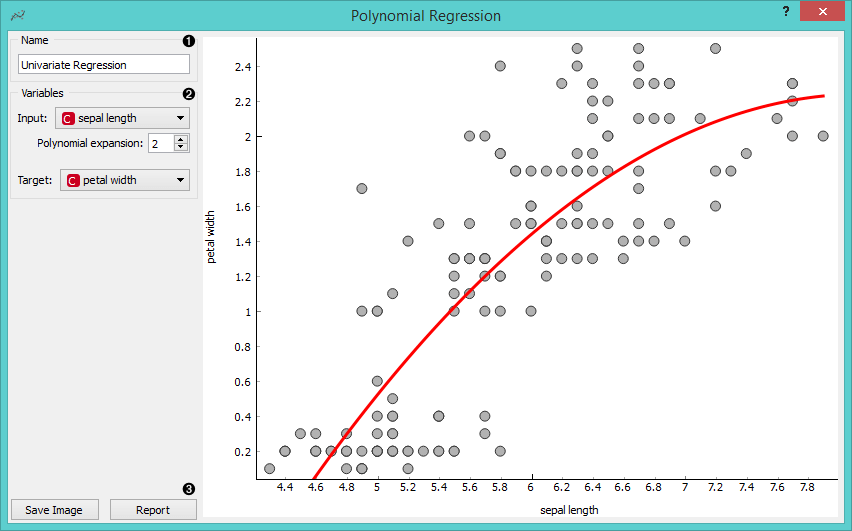
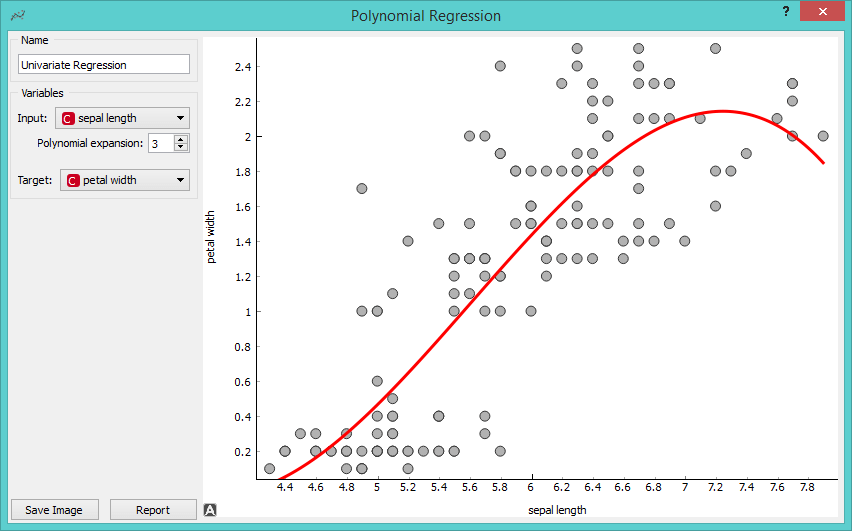
The line can fit better if we increase the Polynomial expansion parameter. Say, we set it to 3.
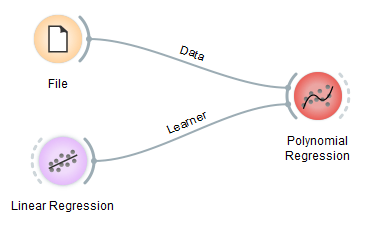
To observe different results, change Linear Regression to any other regression learner from Orange. Example below is done with the Tree learner.