Pythagorean Tree
Pythagorean tree visualization for classification or regression trees.
Inputs
- Tree: tree model
- Selected Data: instances selected from the tree
Pythagorean Trees are plane fractals that can be used to depict general tree hierarchies as presented in an article by Fabian Beck and co-authors. Pythagorean Tree is an alternative to the Tree Viewer, both of which are used for visualizing the Tree model. While Tree Viewer is easier to interpret, Pythagorean trees are more compact.
Pythagorean Tree is interactive: click on any of the nodes (squares) to select training data instances that were associated with that node.
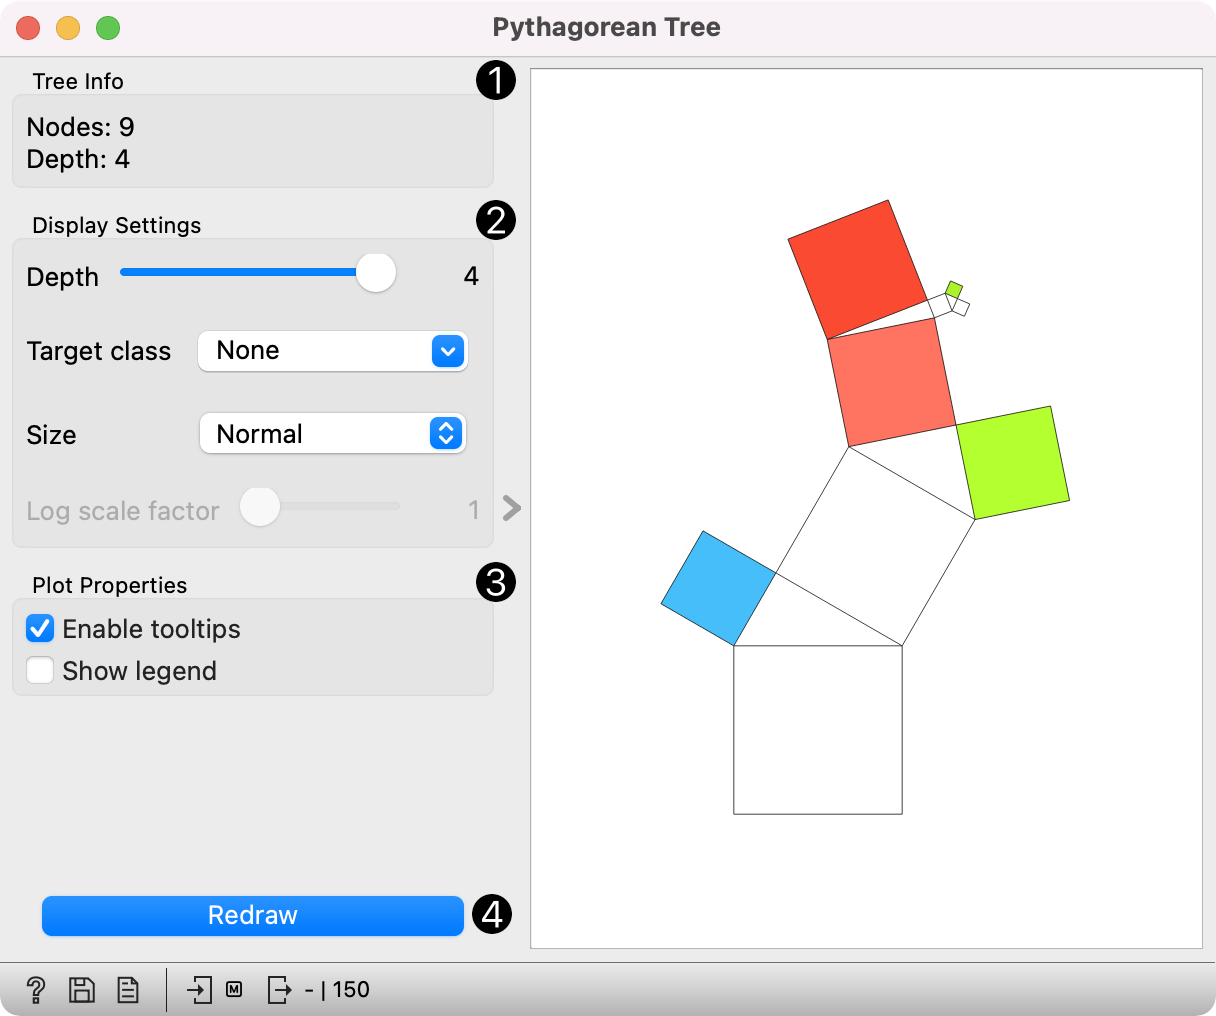
- Information on the input tree model.
- Visualization parameters:
- Depth: set the depth of displayed trees.
- Target class (for classification trees): the intensity of the color for nodes of the tree will correspond to the probability of the target class. If None is selected, the color of the node will denote the most probable class.
- Node color (for regression trees): node colors can correspond to mean or standard deviation of class value of the training data instances in the node.
- Size: define a method to compute the size of the square representing the node. Normal will keep node sizes correspond to the size of training data subset in the node. Square root and Logarithmic are the respective transformations of the node size.
- Log scale factor is only enabled when logarithmic transformation is selected. You can set the log factor between 1 and 10.
- Plot properties:
- Enable tooltips: display node information upon hovering.
- Show legend: shows color legend for the plot.
- Redraw the visualization.
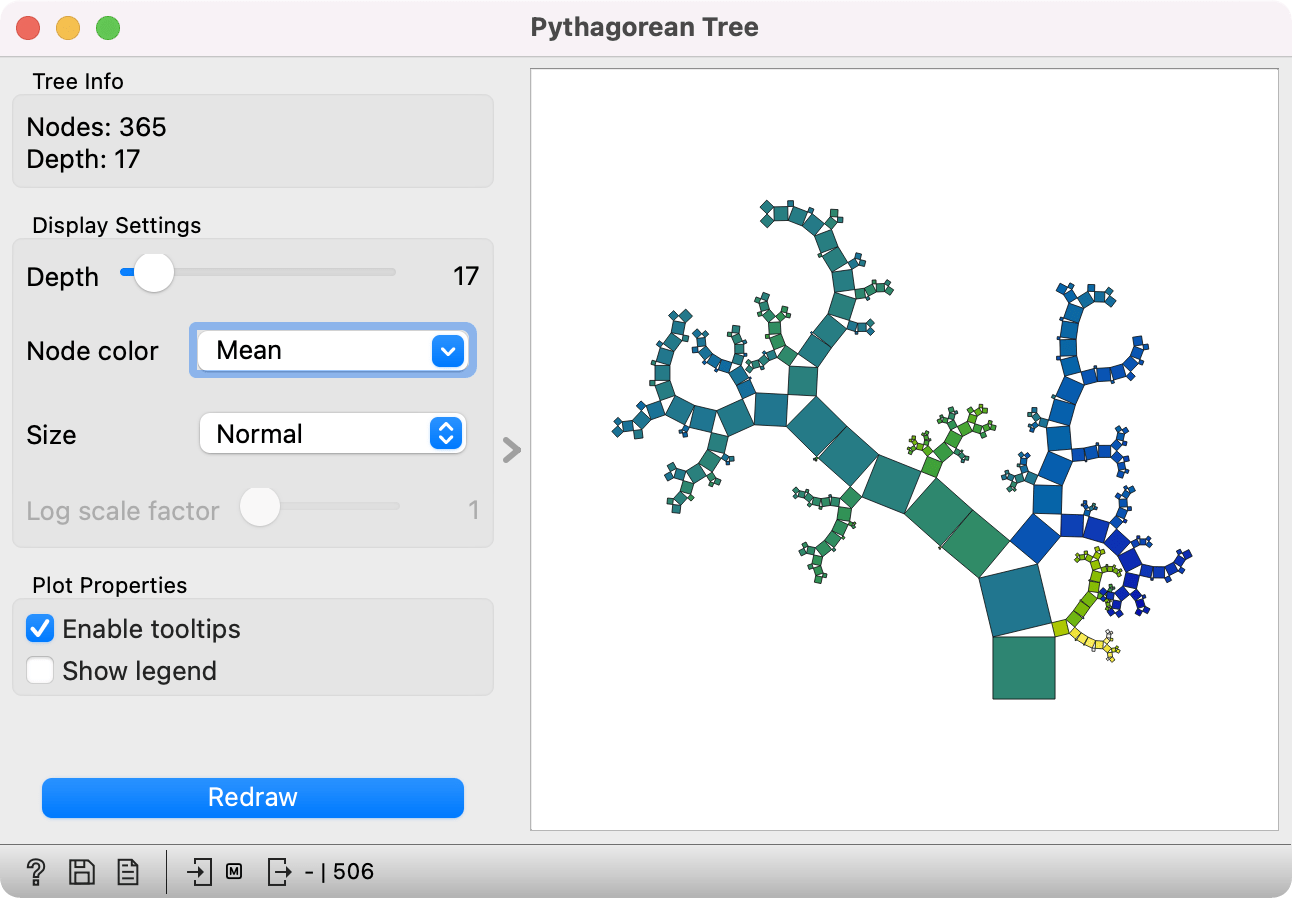
Pythagorean Tree can visualize both classification and regression trees. Below is an example for regression tree. The only difference between the two is that regression tree doesn't enable coloring by class, but can color by class mean or standard deviation.
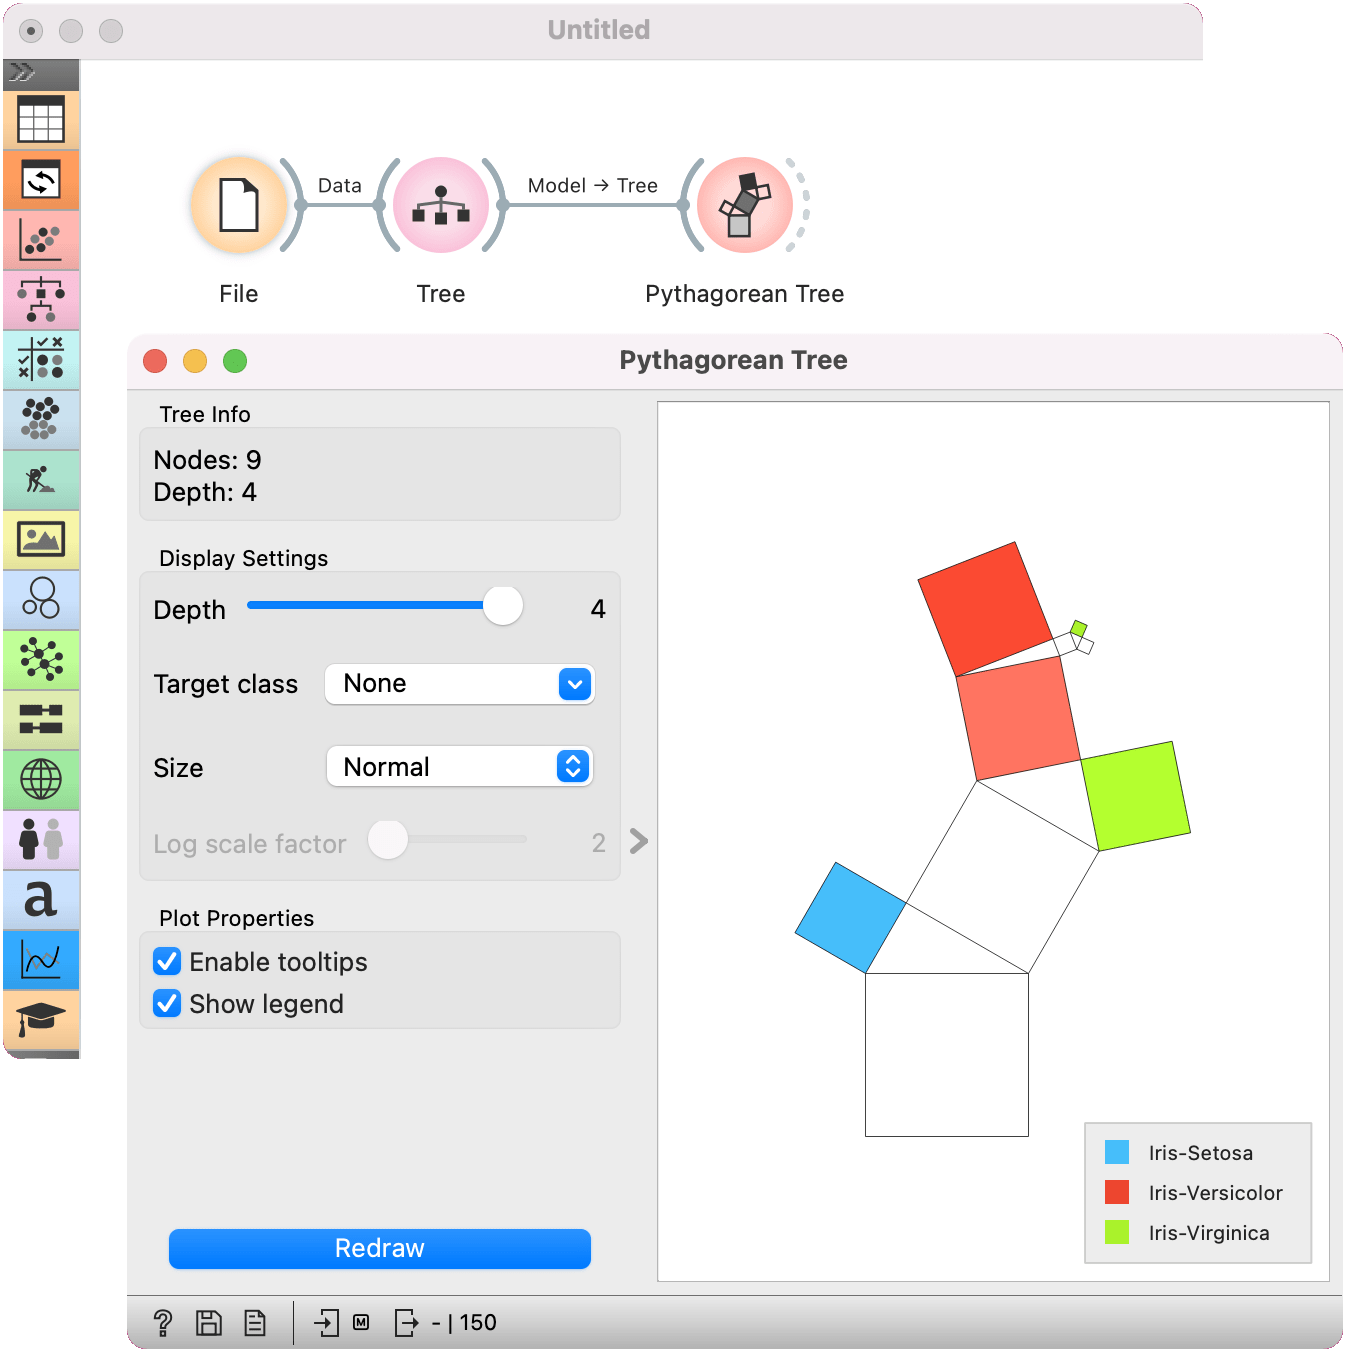
Example
Here is a simple workflow for the Pythagorean Tree widget. We have used the iris dataset for this example. We pass the data to the Tree model to build a decision tree. Then, we pass the model to the Pythagorean Tree widget, which visually represents the constructed model.
References
Beck, F., Burch, M., Munz, T., Di Silvestro, L. and Weiskopf, D. (2014). Generalized Pythagoras Trees for Visualizing Hierarchies. In IVAPP '14 Proceedings of the 5th International Conference on Information Visualization Theory and Applications, 17-28.