Manifold Learning
Nonlinear dimensionality reduction.
Inputs
- Data: input dataset
Outputs
- Transformed Data: dataset with reduced coordinates
Manifold Learning is a technique which finds a non-linear manifold within the higher-dimensional space. The widget then outputs new coordinates which correspond to a two-dimensional space. Such data can be later visualized with Scatter Plot or other visualization widgets.
 {width=50%}
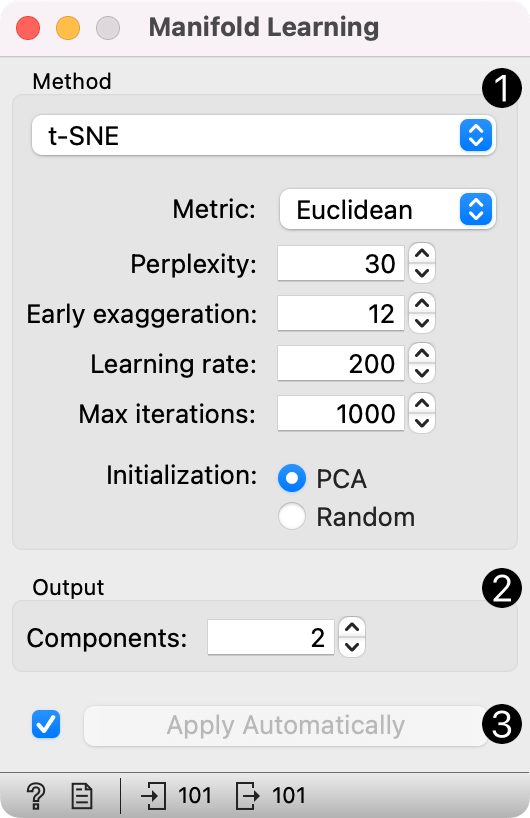
- Method for manifold learning:
- t-SNE, see also t-SNE widget
- Metric: set a distance measure (Euclidean, Manhattan, Chebyshev, Jaccard)
- Perplexity: roughly the number of nearest neighbors to which distances will be preserved
- Early exaggeration: increase the attractive forces between points
- Learning rate: how much parameters are adjusted during each optimization step
- Max iterations: maximum number of times optimization is run
- Initialization: method for initialization of the algorithm (PCA or random)
- MDS, see also MDS widget
- max iterations: maximum number of times optimization is run
- initialization: method for initialization of the algorithm (PCA or random)
- Isomap
- number of neighbors: local geometry to consider in dimensionality reduction
- Locally Linear Embedding
- method: standard, modified, hessian eigenmap, or local
- number of neighbors: local geometry to consider in dimensionality reduction
- max iterations: maximum number of times optimization is run
- Spectral Embedding
- affinity: method for constructing affinity matrix (nearest neighbors or RFB kernel)
- t-SNE, see also t-SNE widget
- Output: the number of reduced features (components).
- If Apply automatically is ticked, changes will be propagated automatically. Alternatively, click Apply.
Manifold Learning widget produces different embeddings for high-dimensional data.
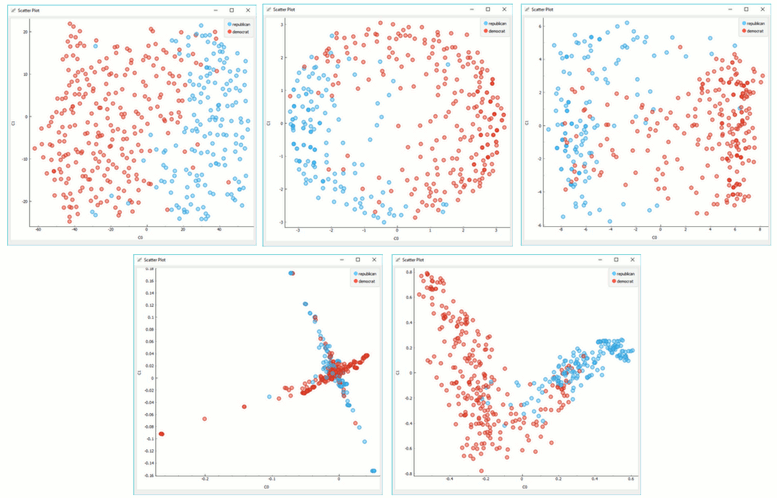
From left to right, top to bottom: t-SNE, MDS, Isomap, Locally Linear Embedding and Spectral Embedding.
Preprocessing
All projections use default preprocessing if necessary. It is executed in the following order:
- continuization of categorical variables (with one feature per value)
- imputation of missing values with mean values
To override default preprocessing, preprocess the data beforehand with Preprocess widget.
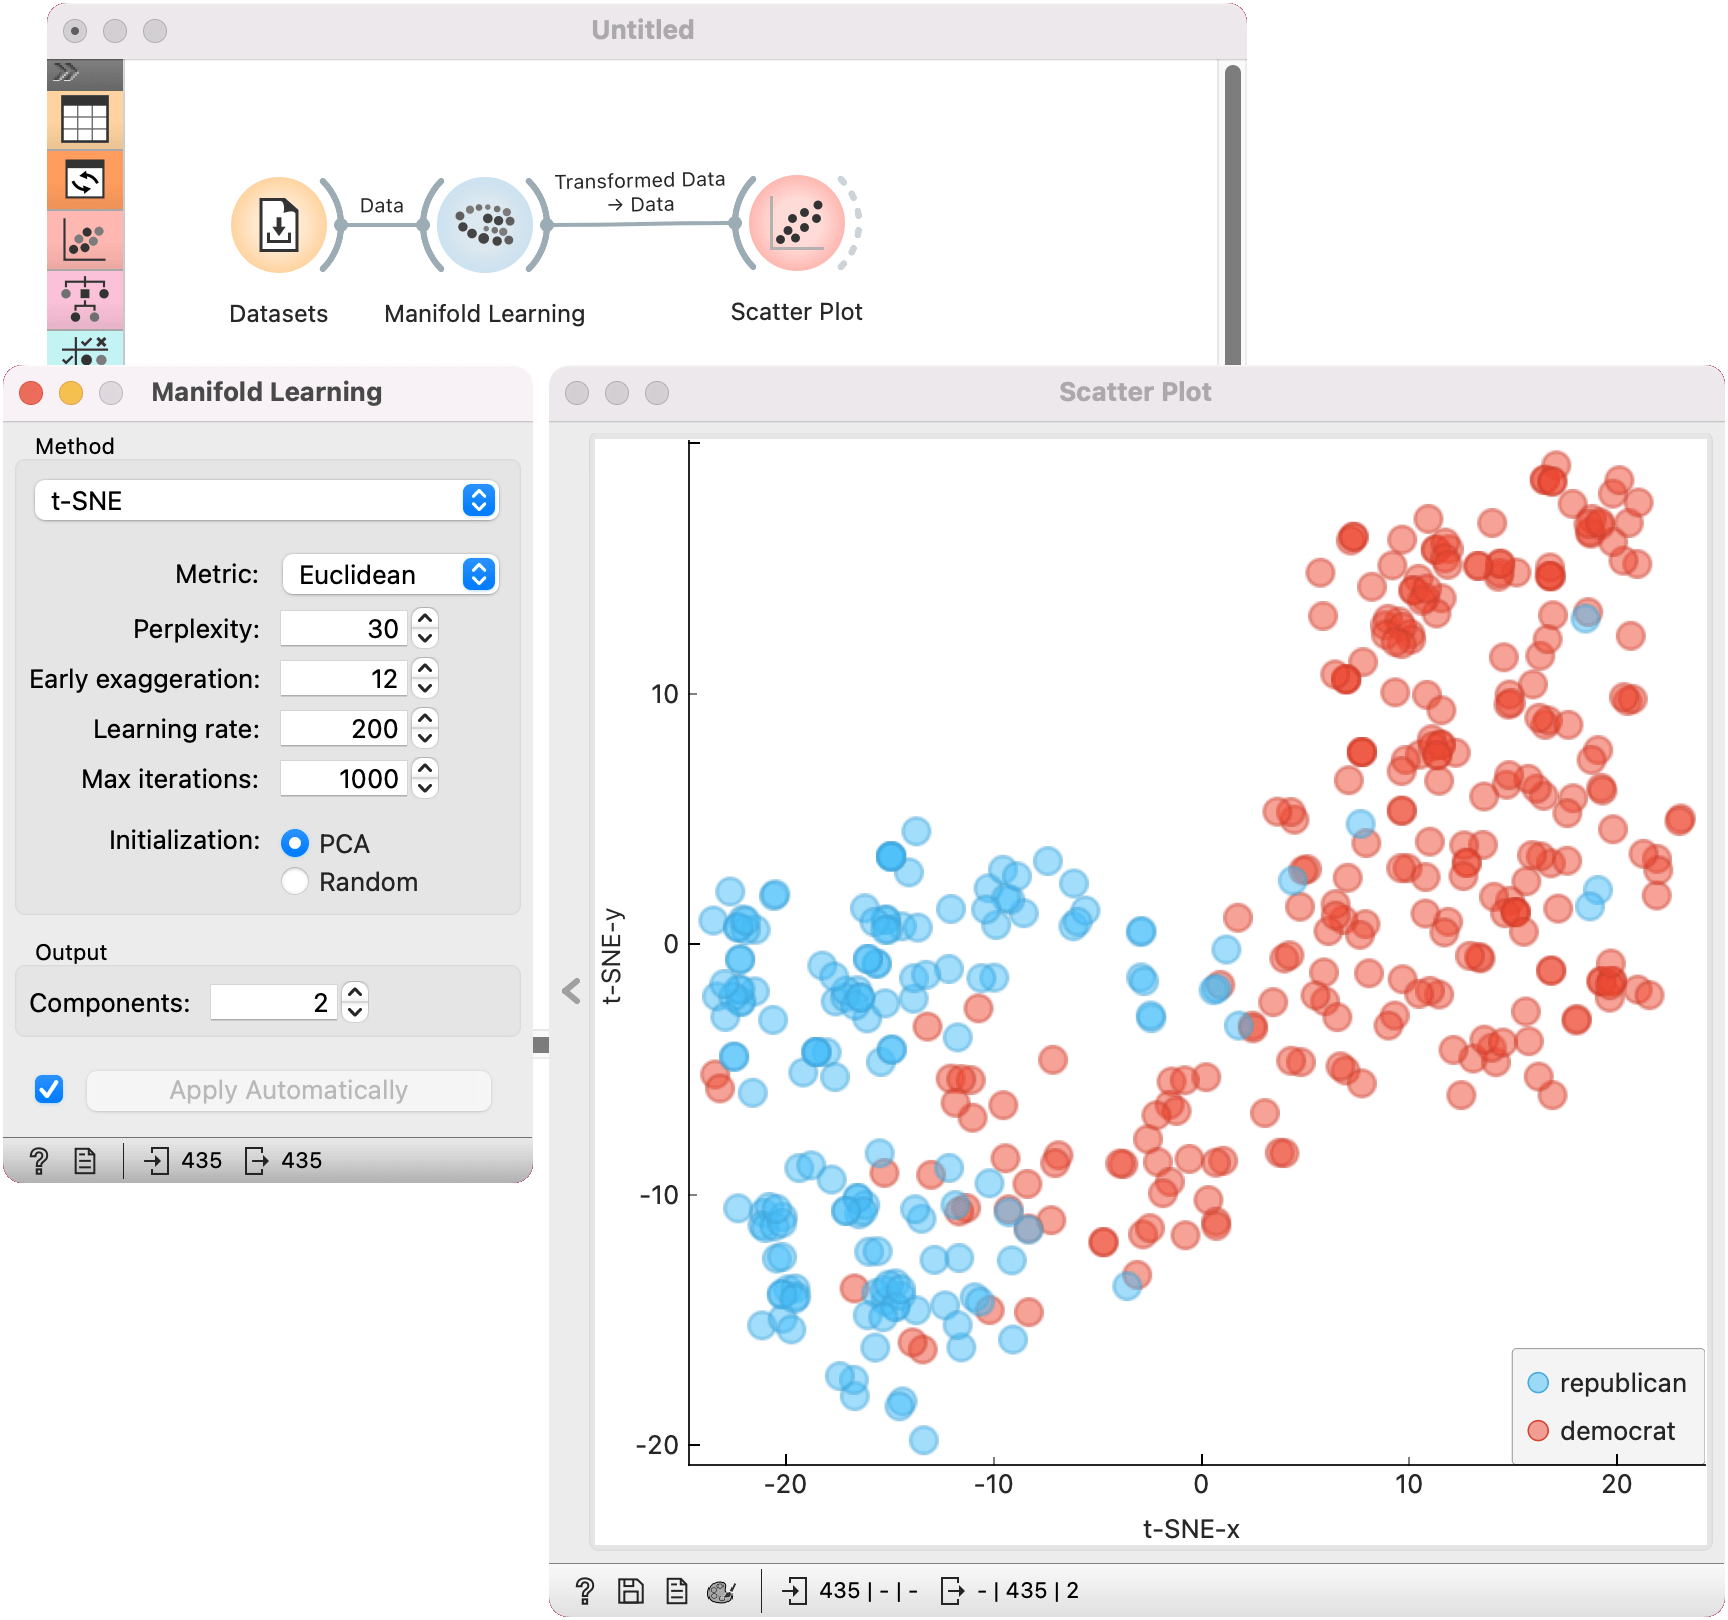
Example
Manifold Learning widget transforms high-dimensional data into a lower dimensional approximation. This makes it great for visualizing datasets with many features. We used voting.tab to map 16-dimensional data onto a 2D graph. Then we used Scatter Plot to plot the embeddings.