Widgets
Data
-
File
-
CSV File Import
-
Datasets
-
SQL Table
-
Data Table
-
Paint Data
-
Data Info
-
Data Sampler
-
Select Columns
-
Select Rows
-
Pivot Table
-
Rank
-
Correlations
-
Merge Data
-
Concatenate
-
Select by Data Index
-
Transpose
-
Randomize
-
Preprocess
-
Apply Domain
-
Impute
-
Outliers
-
Edit Domain
-
Python Script
-
Create Instance
-
Color
-
Continuize
-
Create Class
-
Discretize
-
Feature Constructor
-
Feature Statistics
-
Neighbors
-
Purge Domain
-
Save Data
Visualize
Model
Evaluate
Unsupervised
Spectroscopy
Text Mining
-
Corpus
-
Import Documents
-
The Guardian
-
NY Times
-
Pubmed
-
Twitter
-
Wikipedia
-
Preprocess Text
-
Corpus to Network
-
Bag of Words
-
Document Embedding
-
Similarity Hashing
-
Sentiment Analysis
-
Tweet Profiler
-
Topic Modelling
-
Corpus Viewer
-
Word Cloud
-
Concordance
-
Document Map
-
Word Enrichment
-
Duplicate Detection
-
Statistics
Bioinformatics
Single Cell
Image Analytics
Networks
Geo
Educational
Time Series
Associate
Align Datasets
Alignment of multiple datasets with a diagram of correlation visualization.
Inputs
- Data: single cell dataset
Outputs
- Transformed Data: aligned data
- Genes per n. Components
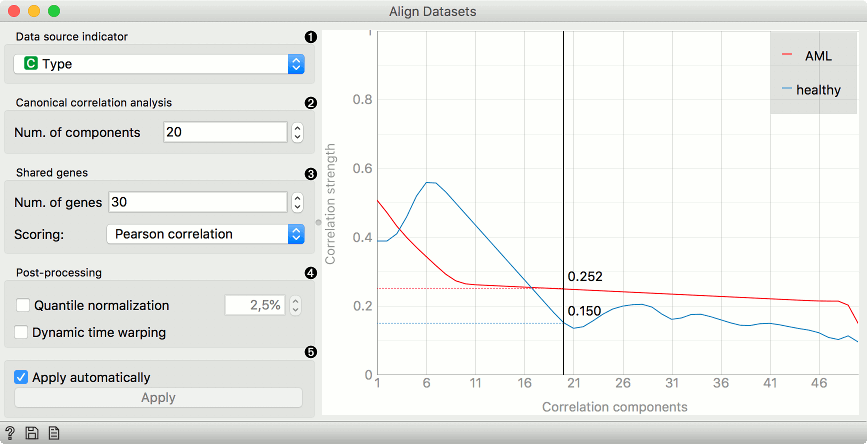
- Data source indicator
- Number of components for canonical correlation analysis.
- Number of shared genes and the scoring method for alignment. Scoring can be done with Pearson, Spearman and Biweights midcorrelation.
- Tick the box to use the percent of quantile normalization and dynamic time warping.
- If Apply automatically is ticked, the results will be communicated automatically. Alternatively, press Apply.