KEGG Pathways
Diagrams of molecular interactions, reactions, and relations.
Inputs
- Data: Data set.
- Reference: Referential data set.
Outputs
- Selected Data: Data subset.
- Unselected Data: Remaining data.
KEGG Pathways widget displays diagrams of molecular interactions, reactions and relations from the KEGG Pathways Database. It takes data on gene expression as an input, matches the genes to the biological processes and displays a list of corresponding pathways. To explore the pathway, the user can click on any process from the list or arrange them by P-value to get the most relevant processes at the top.
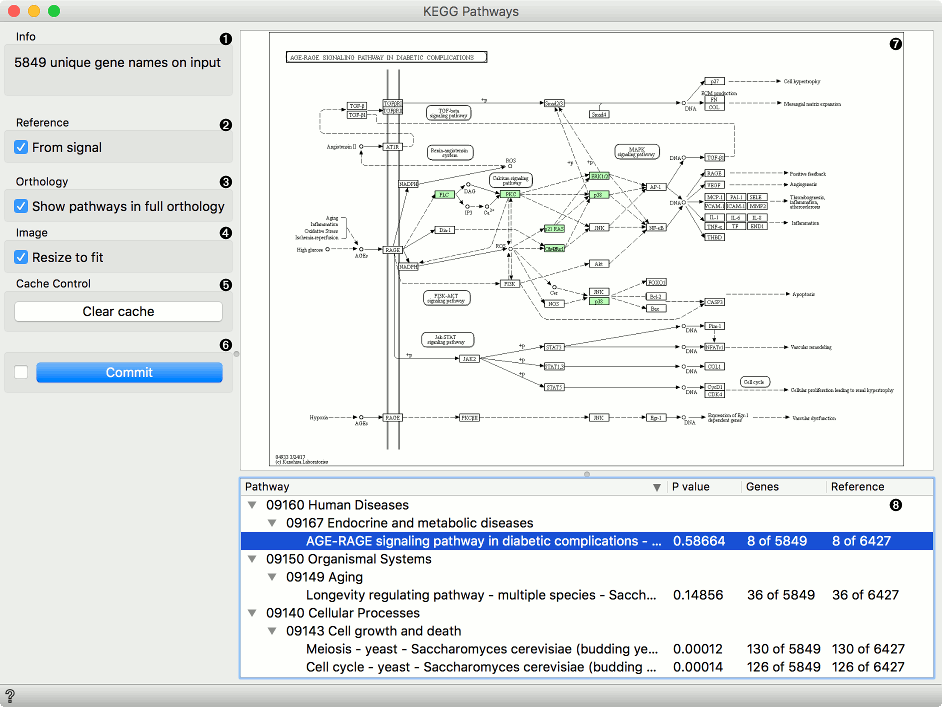
- Information on the input genes.
- If you have a separate reference set in the input, tick From signal to use these data as reference.
- To have pathways listed and displayed by vertical descent, tick Show pathways in full orthology.
- To fit the image to screen, tick Resize to fit. Untick the box if you wish to explore the pathways.
- To clear all locally cached KEGG data, press Clear cache.
- When Auto commit is on, the widget will automatically apply the changes. Alternatively press Commit.
- A list of pathways either as processes or in full orthology. Click on the process to display the pathway. You can sort the data by P-value to get the most relevant results at the top.
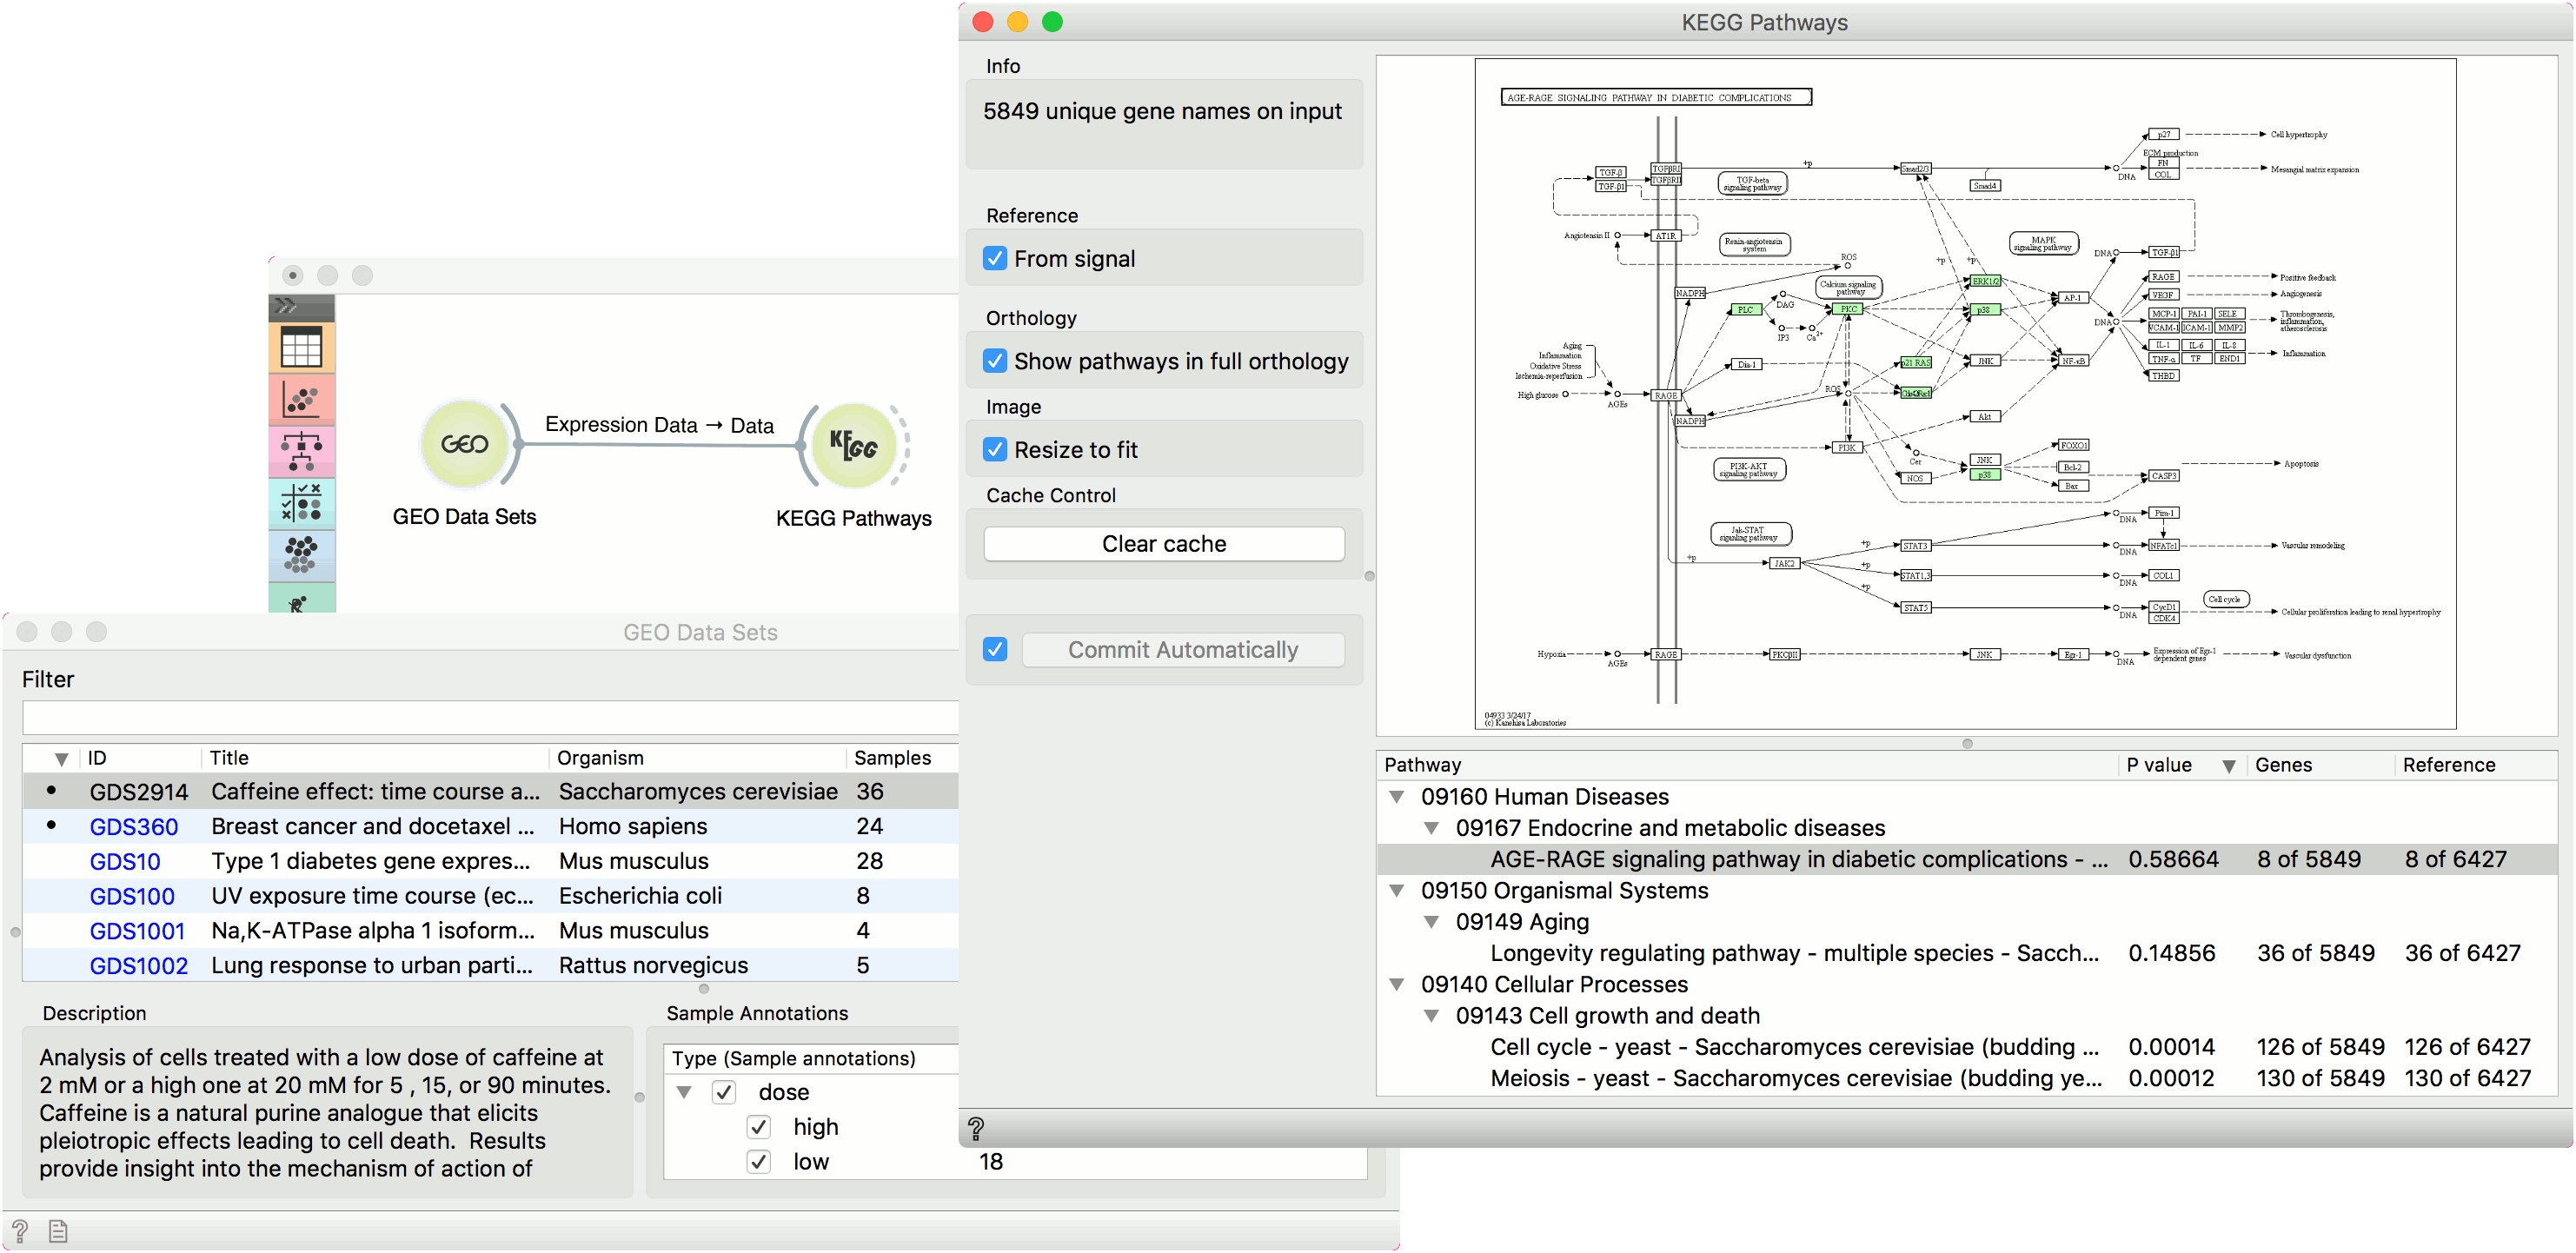
Example
This simple example shows how to visualize interactions with KEGG Pathways. We have loaded the Caffeine effect: time courses and dose response (GDS2914) data with the GEO Data Sets widget. Then we have observed the pathways in KEGG Pathways. We have used reference from signal and selected AGE-RAGE signaling pathway in diabetic complications.