survival analysis, cox regression
Cox regression in Orange
Jaka Kokošar
Jan 27, 2023
In our previous blog post, we discussed the basic concepts of survival analysis, the types of problems it aims to solve and briefly introduced the Kaplan-Meier method. We used the Kaplan-Meier widget to estimate a population's survival probability over time, taking into account a specific covariate. However, we did not account for the impact of other covariates on the survival outcome.
When studying patient outcomes in clinical settings, it is essential to consider multiple factors that describe patients' conditions and may affect survival. The Cox regression model is widely used in survival analysis. It estimates the hazard ratio of an event of interest while adjusting for the effect of included covariates. For those more interested, we suggest the article by Bradburn et al. on the topic of analyzing survival data with multiple covariates.
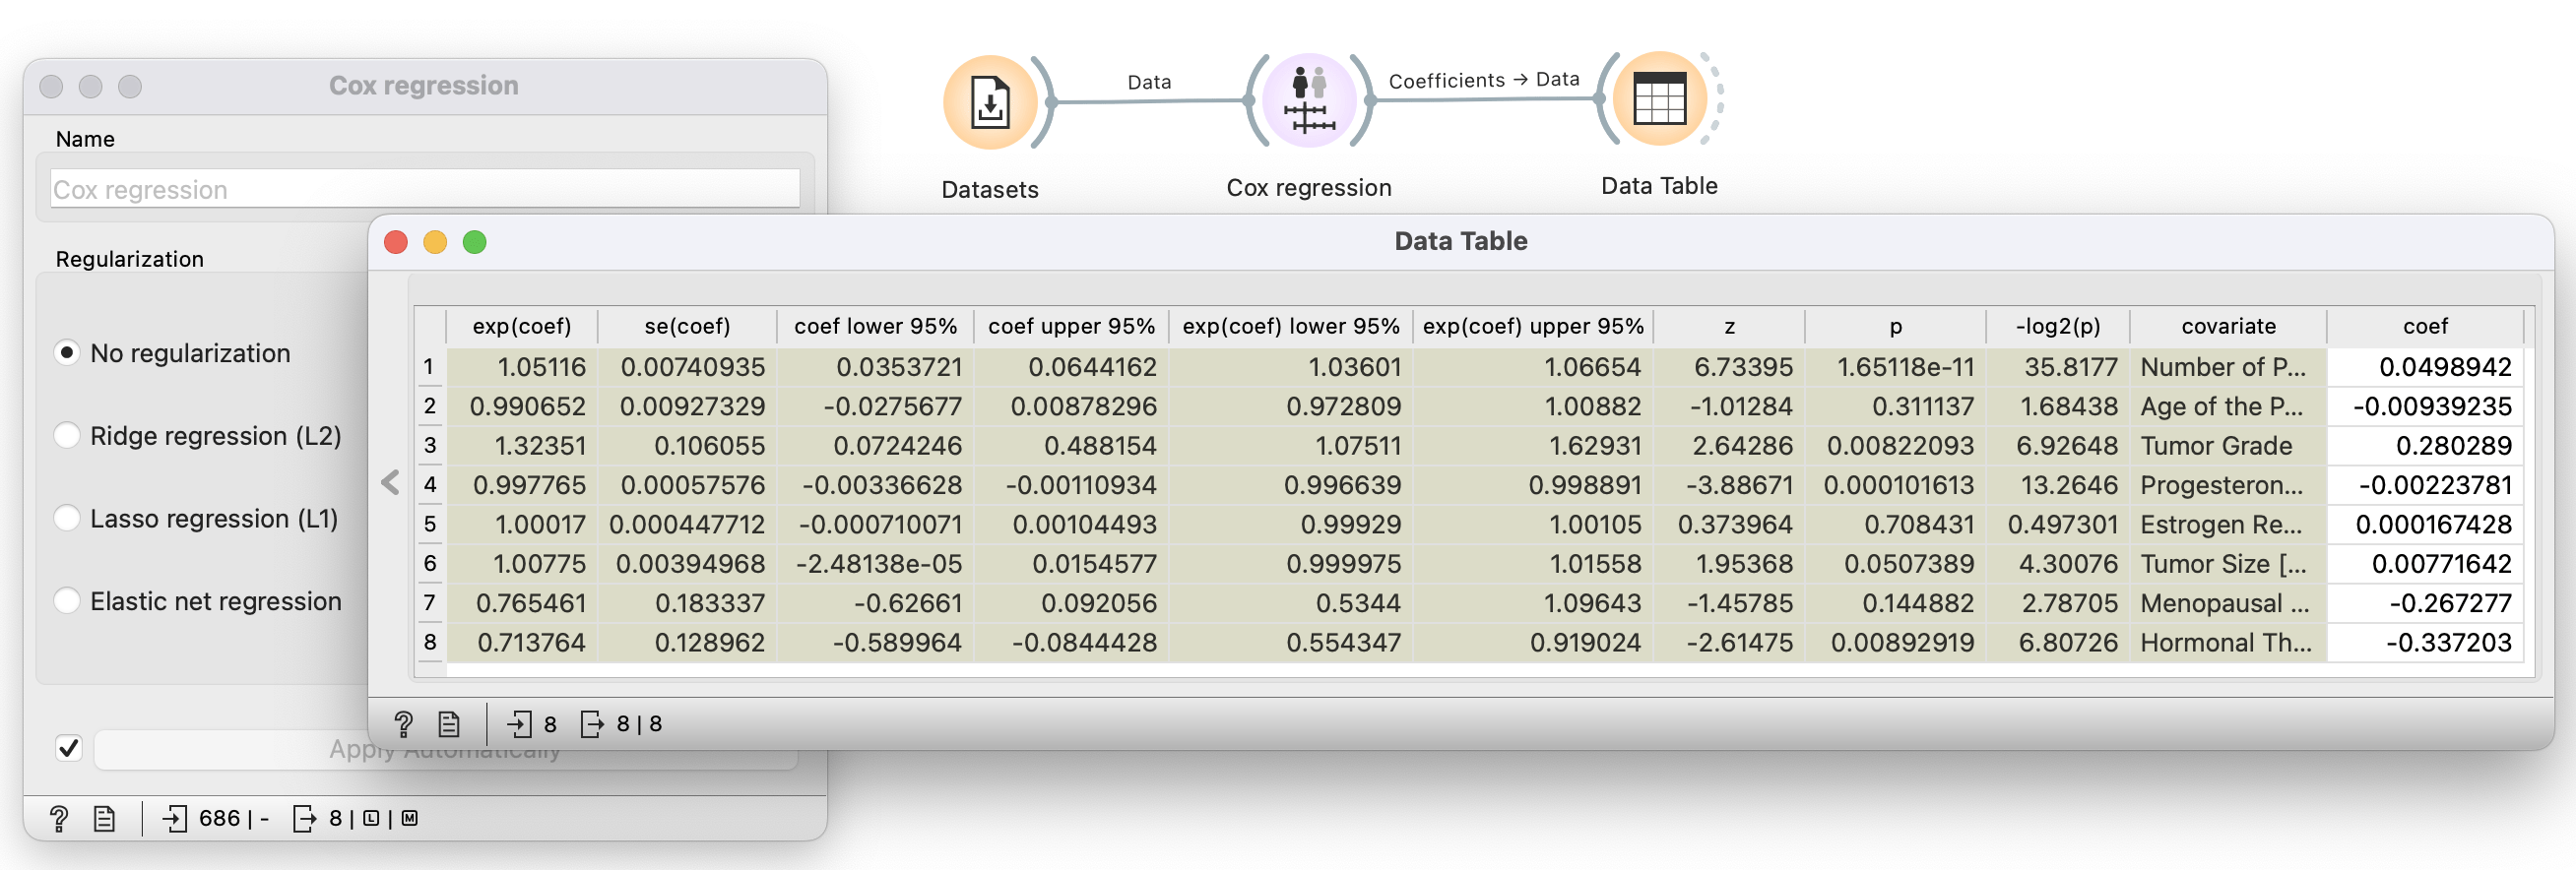
The illustration above demonstrates how to perform a Cox regression analysis by linking the German Breast Cancer Study Group 2 data from the Datasets widget to the Cox regression widget and displaying the results in a Data table. The documentation of Lifelines, the python library utilized by the survival widgets in Orange, provides a clear explanation of how to interpret the presented results.
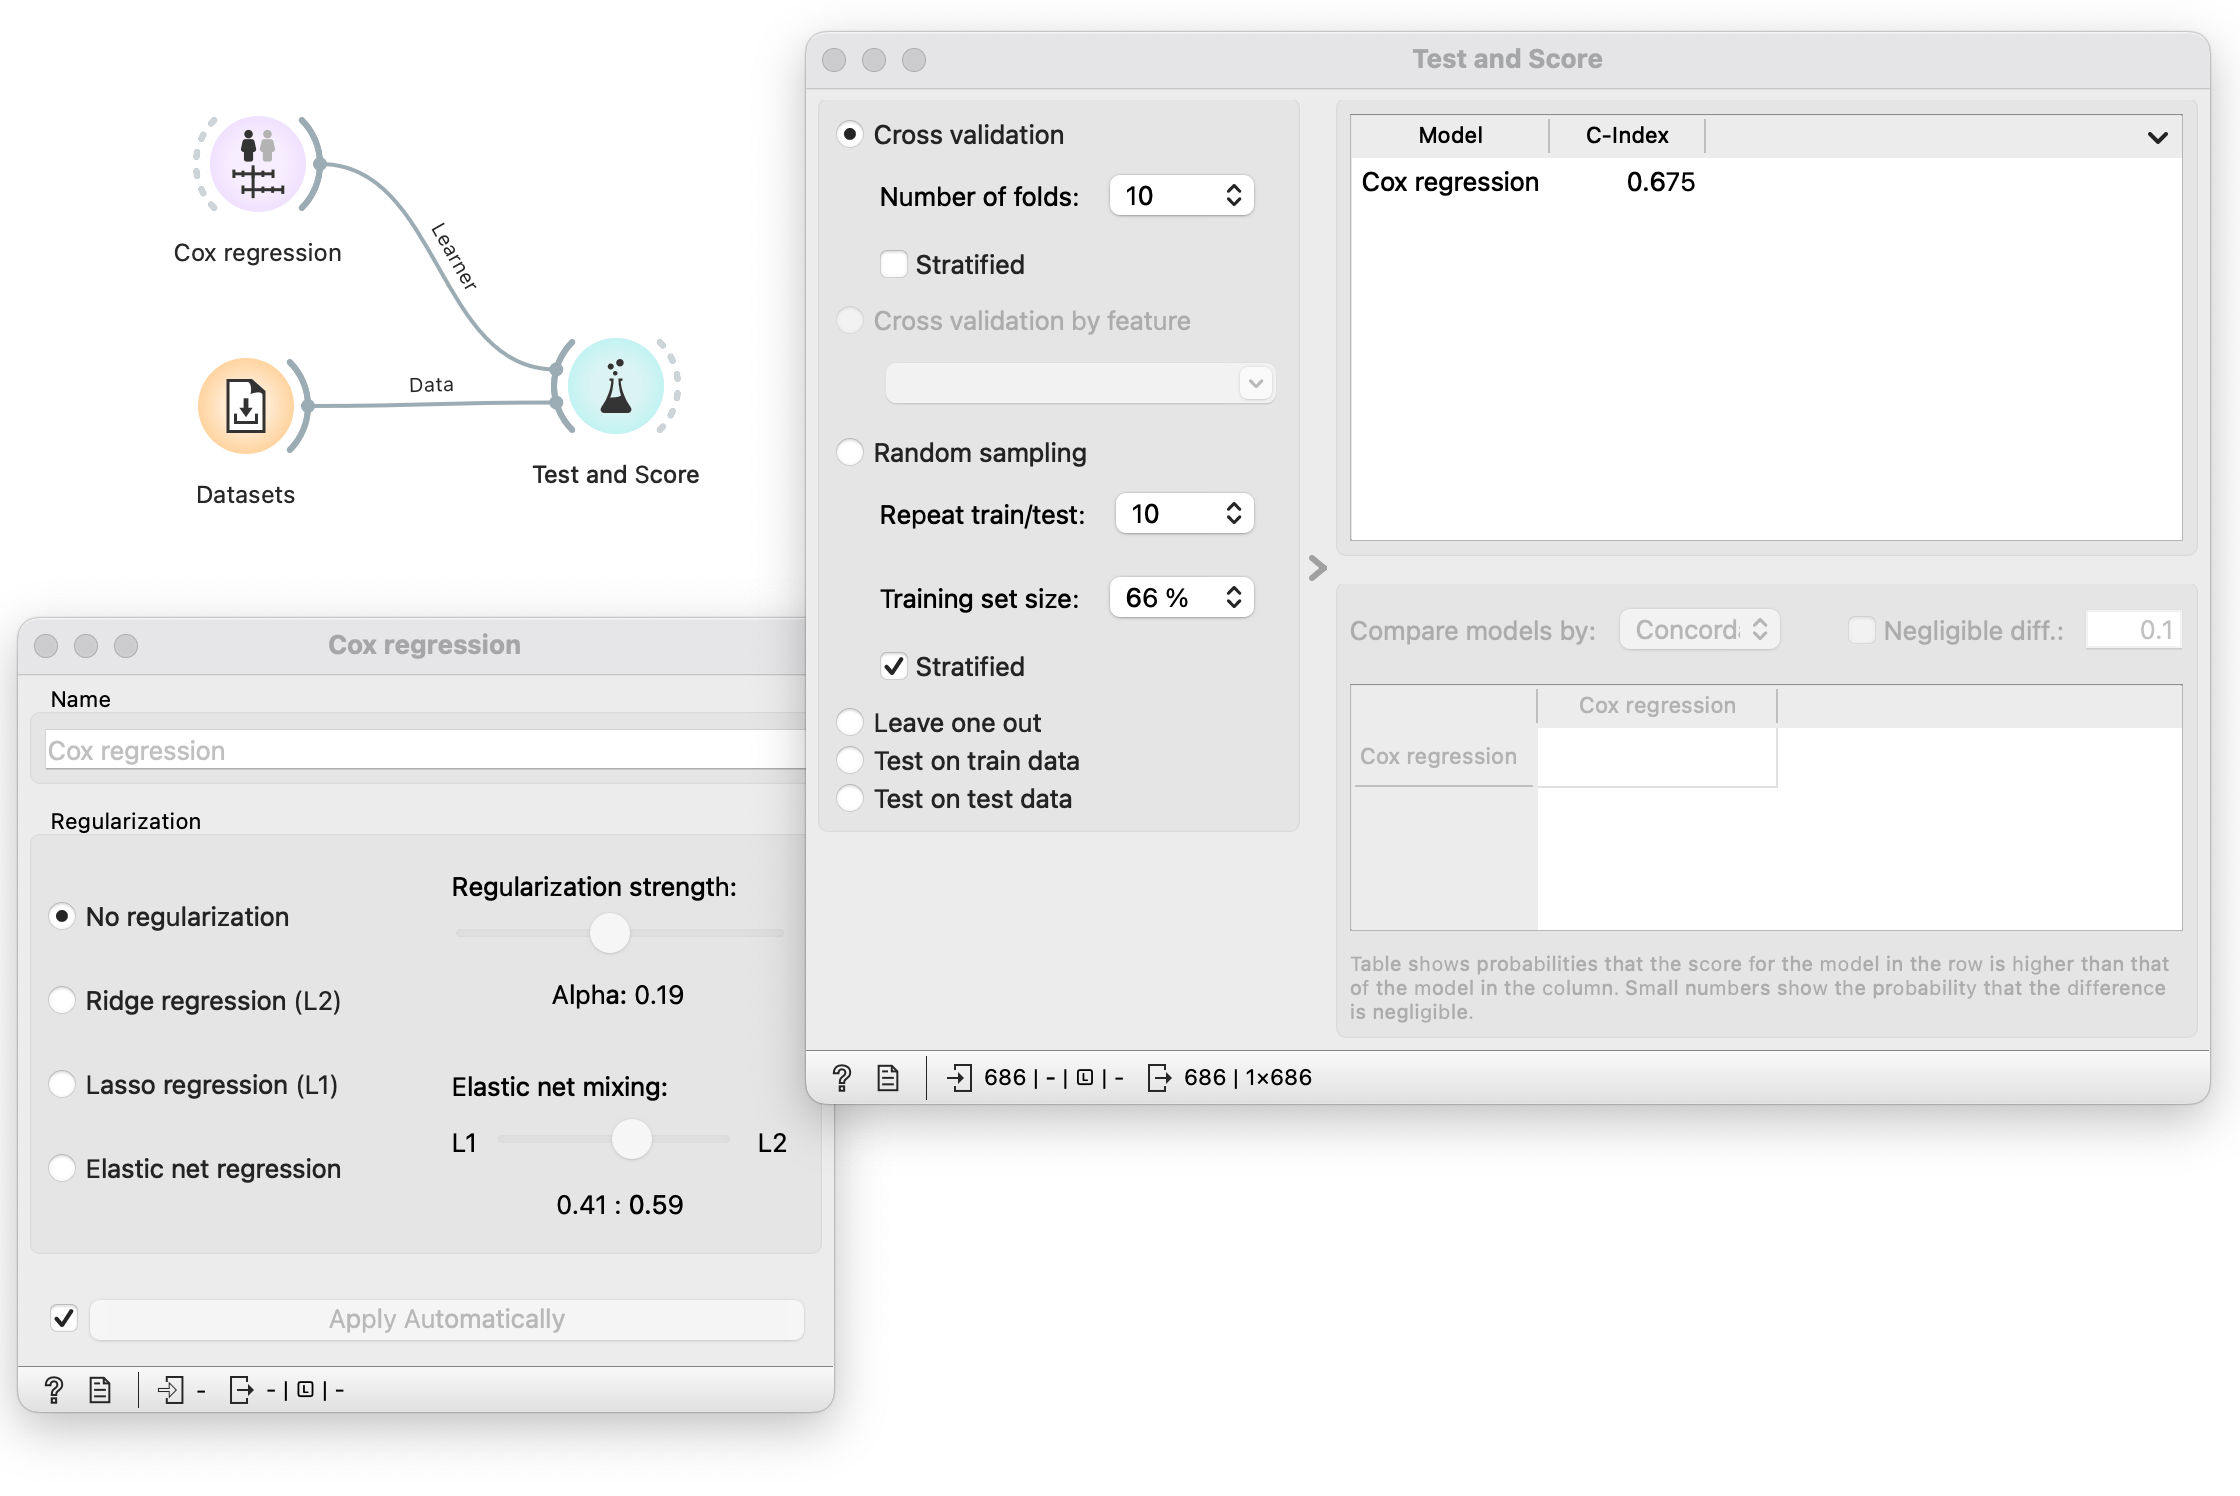
The survival analysis add-on in Orange seamlessly integrates with the rest of the widgets, enabling the construction of standard Orange workflows. For example, in the image below, we demonstrate how we can use the cross-validation strategy to test and score the Cox regression model based on the Concordance index as a measure of predictive accuracy.