orange, workshop
Training with Orange: A Tutorial at AIME 2022 in Halifax
Blaž Zupan
Apr 26, 2022
When
June 14, 2022
Where
Halifax, Canada. This is a half-day, on site tutorial organized during the AIME 2022 conference.
On Tutorial
In the tutorial, we will claim and demonstrate that, given the right tool, it may take only a few hours to familiarize outsiders in data science.
The tutorial is intended for teachers and trainees: we will present both the training steps and, as a demonstration, go through the actual training. After the tutorial, it should be evident that after a short training of this kind, the professionals can gain enough intuition about data science to recognize opportunities that this field can offer and actively engage in data science projects. Besides good mentors and an encouraging working environment, the right tool is critical for such training.
We will advocate the workflow-based construction of analytical pipelines with interactive visualizations and show that they can be the key to the simplicity of the interface and flexibility to adopt analytics to any data type and problem domain. We will illustrate the use of such a tool on practical cases and explain clustering, model development, data visualization, and analysis of data with gene expressions.
The tutorial will be hands-on, and the attendees will be encouraged to bring their laptops and follow me through practical cases.
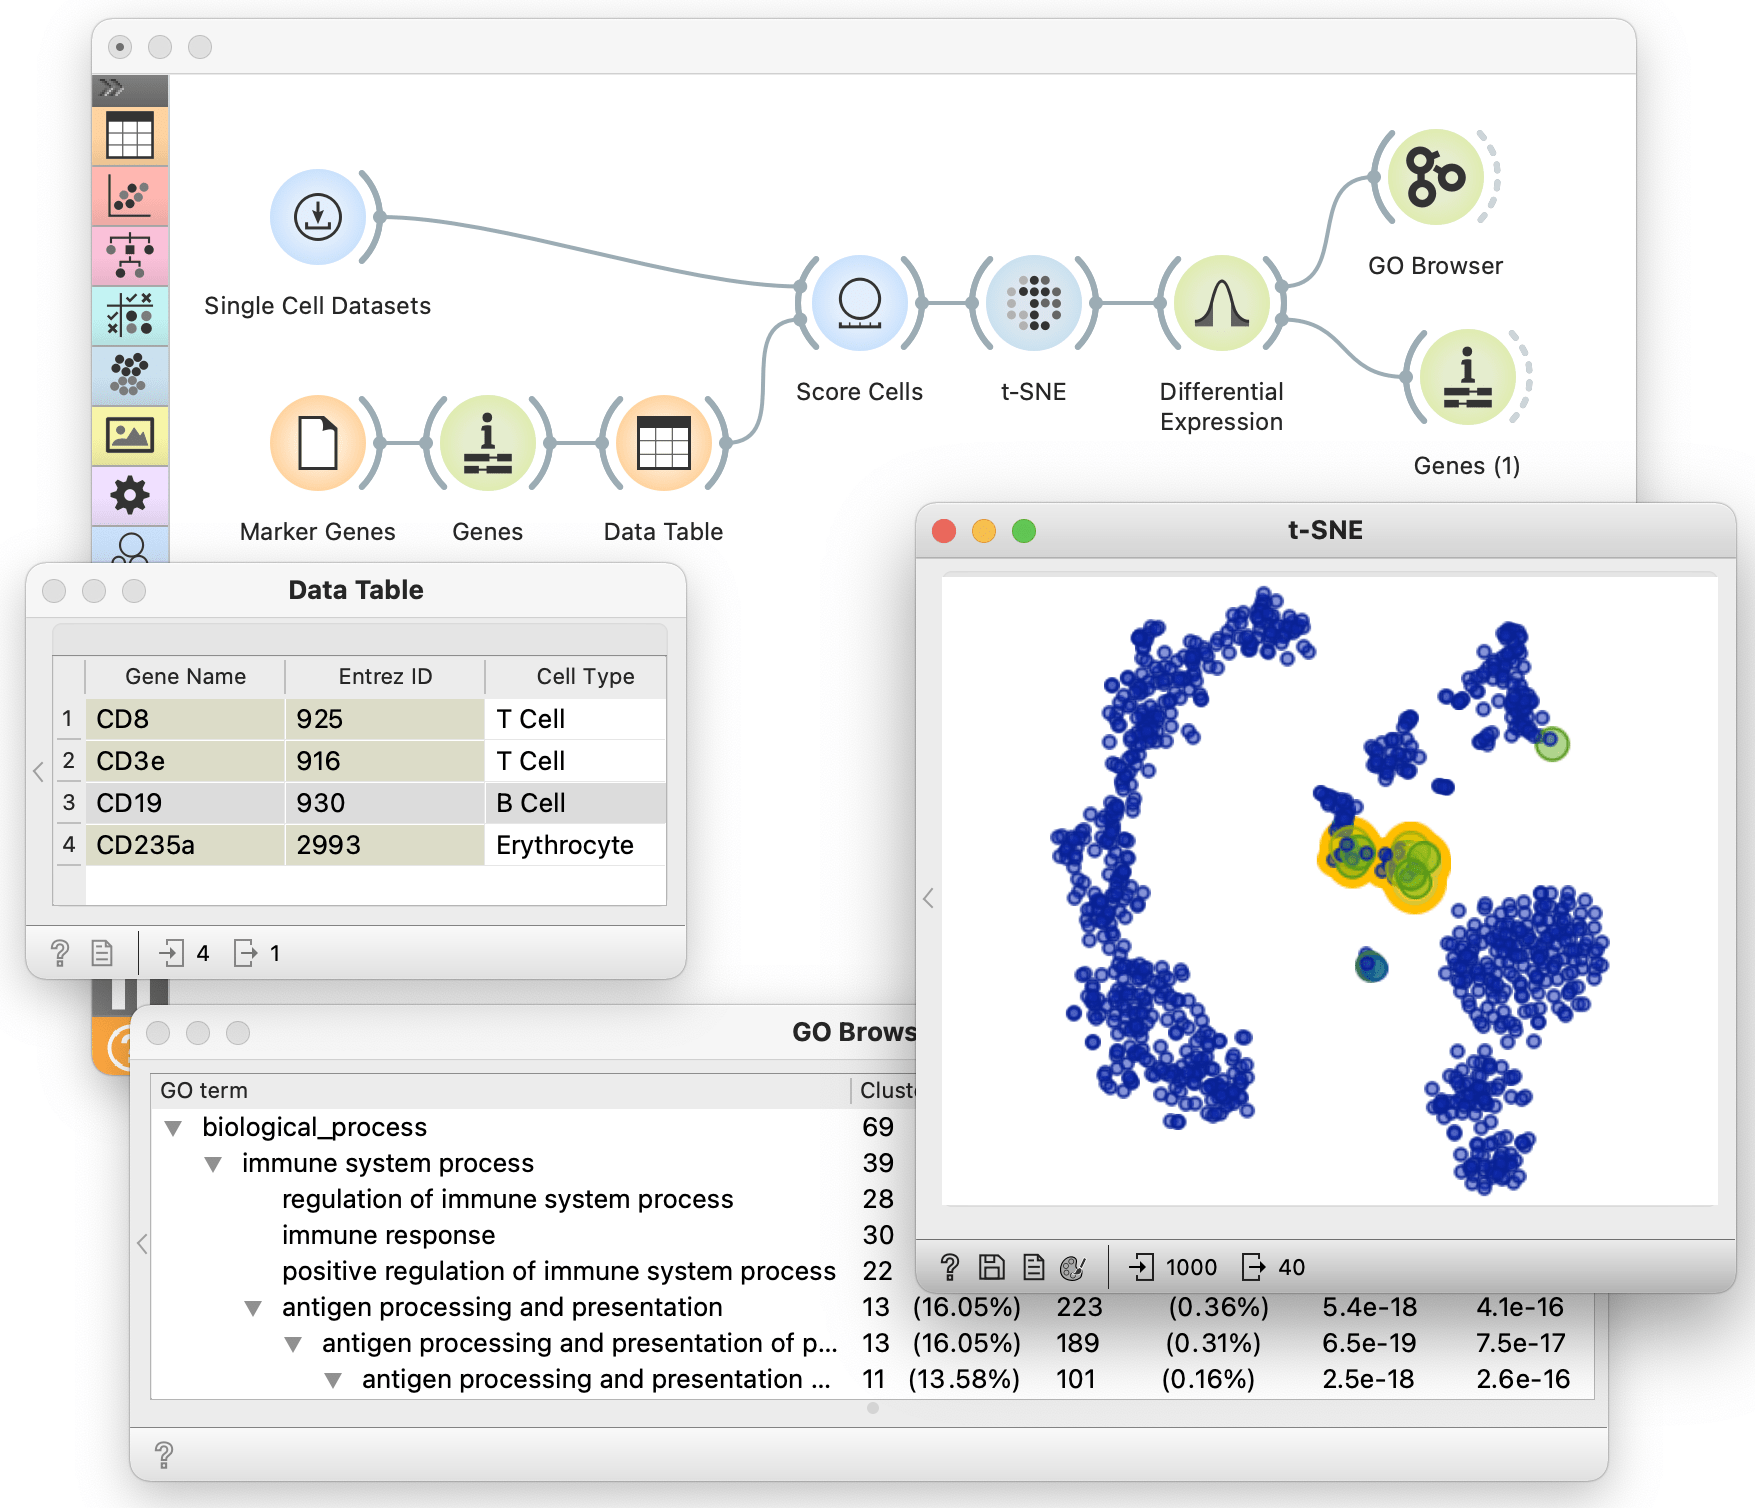
The tutorial will use Orange, our software tool that features workflows, interactive visualizations, and blends visualizations and machine learning. The figure shows the workflow to analyze the landscape of single cells using their expression data and support highlighting of selected gene markers and gene marker discovery. We plan to run this use case and construct a similar workflow during the proposed tutorial.
Covered Topics
For the prospective or actual teachers and professors of machine learning and data science, we will show how to:
- organize a short introductory or advanced course in data science that can take only a few hours but cover a substantial number of topics from machine learning and data visualization,
- train intuitive concepts of data science, rather than dive into details of mathematics and statistics,
- use the workflows-based environment to soften the learning curve and train data science without invoking any computer programming,
- use interactive visualizations and visual analytics to engage in data exploration and additionally motivate the trainees and make training lessons exciting and engaging,
- design a practical training course that immediately dives into the data and helps trainees understand data science on practical use cases,
- design a course that uses case-based studies and avoids using any powerpoints.
Everyone interested in learning about data science or those who would like to enjoy a fast-paced walk through the machine learning landscape can join the tutorial. The tutorial will cover the topics of
- clustering, including hierarchical clustering, k-means, visualization of clustering results and explanation of clusters,
- dimensionality reduction approaches and design of data maps with methods like MDS and t-SNE,
- predictive modeling using essential supervised machine learning techniques (logistic regression, random forests, neural networks) and several tools that can explain the structure of the models, like nomograms,
- overfitting, how to cheat with it and how to avoid it,
- evaluation of prediction models, including cross-validation and assessment of accuracy.
The listed topics conceptually cover a substantial part of the machine learning landscape. The workshop aims to demonstrate that using the right tools and pedagogical approaches, these can be covered, in an intuitive way, in only a few hours.
During the tutorial, we will showcase the data science and machine learning methods on several datasets that will include, among others, data with socioeconomic and health indices of countries, gene expression data from single-cell experiments, and images from molecular biology.
Motivation behind this Tutorial
Machine learning methods are drivers of change in sciences and engineering. The computational approaches that can sip through vast collections of data, extract exciting patterns, and devise predictive models are becoming omnipresent. But only a few professionals understand the basics of data science, and even fewer engage in building models using their data. We need to devise means to train them and familiarize them with core data science concepts without burdening them with mathematical and computer science details. The tools used in such training could also come handing when presenting and communicating the results of the data analysis, where methods from visual analytics can help us actively engage the data owners. Especially in medicine, it may be essential to train medical professionals and students so that they can gain enough intuition about data science to recognize opportunities that this field can offer and actively engage in data science projects.
Intended Audience
- Current or prospective teachers or trainers of data science,
- AIME attendees interested in tools for explorative data analysis, integration of machine learning, and data visualization,
- Data scientists that would like to familiarize themselves with a workflow-based, visual analytics tool that can support active communication of results of data science to the data owners,
- Anyone curious about how we can pack the essentials of data science within a half a day workshop.
Get Engaged
In the tutorial, we will showcase the use of the tool, Orange, for data science training through a set of case studies, and with these introduce the data science topics and methods. We encourage the audience to follow the tutorial and work on their laptops. We will also encourage discussion and active participation through lecturer interactions with the audience through questions on the topic and on the chosen case studies.
Previous Similar Tutorials
In the past five years, our group has perfected the hands-in training approach by carrying out close to a hundred hands-on machine learning and data science workshops around the world, including those in Houston, Ås, Pavia, Luxemburg, Kolkata, Liverpool, Bari, Oslo, Ashburn, Konstanz, Belgrade, Helsinki, Melbourne, Sao Paolo, Verona, and Ljubljana. The workshops and tutorials ranged anyway from an hour to a few days. They were carried out for Ph.D. students, researchers, company professionals, employees of the public sector, and teachers and students in high school. Please refer to our blogs for short reports on some of our workshops.
We have also recently published several manuscripts about the proposed training, including:
- Demšar J, Zupan B (2021) Hands-on training about overfitting, PLOS Computational Biology 17(3): e1008671.
- Godec P, Pančur M, Ilenič N, Čopar A, Stražar M, Erjavec A, Pretnar A, Demšar J, Starič A, Toplak M, Žagar L, Hartman J, Wang H, Bellazzi R, Petrovič U, Garagna S, Zuccotti M, Park D, Shaulsky G, Zupan B (2019) Democratized image analytics by visual programming through integration of deep models and small-scale machine learning, Nature Communications 10(1):4551.
- Stražar M, Žagar L, Kokošar J, Tanko V, Erjavec A, Poličar P, Starič A, Demšar J, Shaulsky G, Menon V, Lamire A, Parikh A, and Zupan B (2019) scOrange – A Tool for Hands-On Training of Concepts from Single Cell Data Analytics, Bioinformatics 35(14):i4-i12.
Related to the type of training we propose to showcase in the tutorial are also short educational videos on data science in Orange available on YouTube.
Presenter
Blaž Zupan, University of Ljubljana, Slovenia, and Baylor College of Medicine, Houston, USA
Prof. Dr. Blaž Zupan teaches artificial intelligence and machine learning at the University of Ljubljana and Baylor College of Medicine in Houston. His research has focused on explainable AI and combinations of machine learning and data visualization techniques. He runs a twenty-member bioinformatics laboratory, developing Orange, a comprehensive open-source toolbox for machine learning. Orange is a great data science training tool, and Zupan’s group has designed and carried out over a hundred hands-on workshops and courses in the past five years. Zupan has published his work in more than a hundred articles that have received over ten thousand citations.