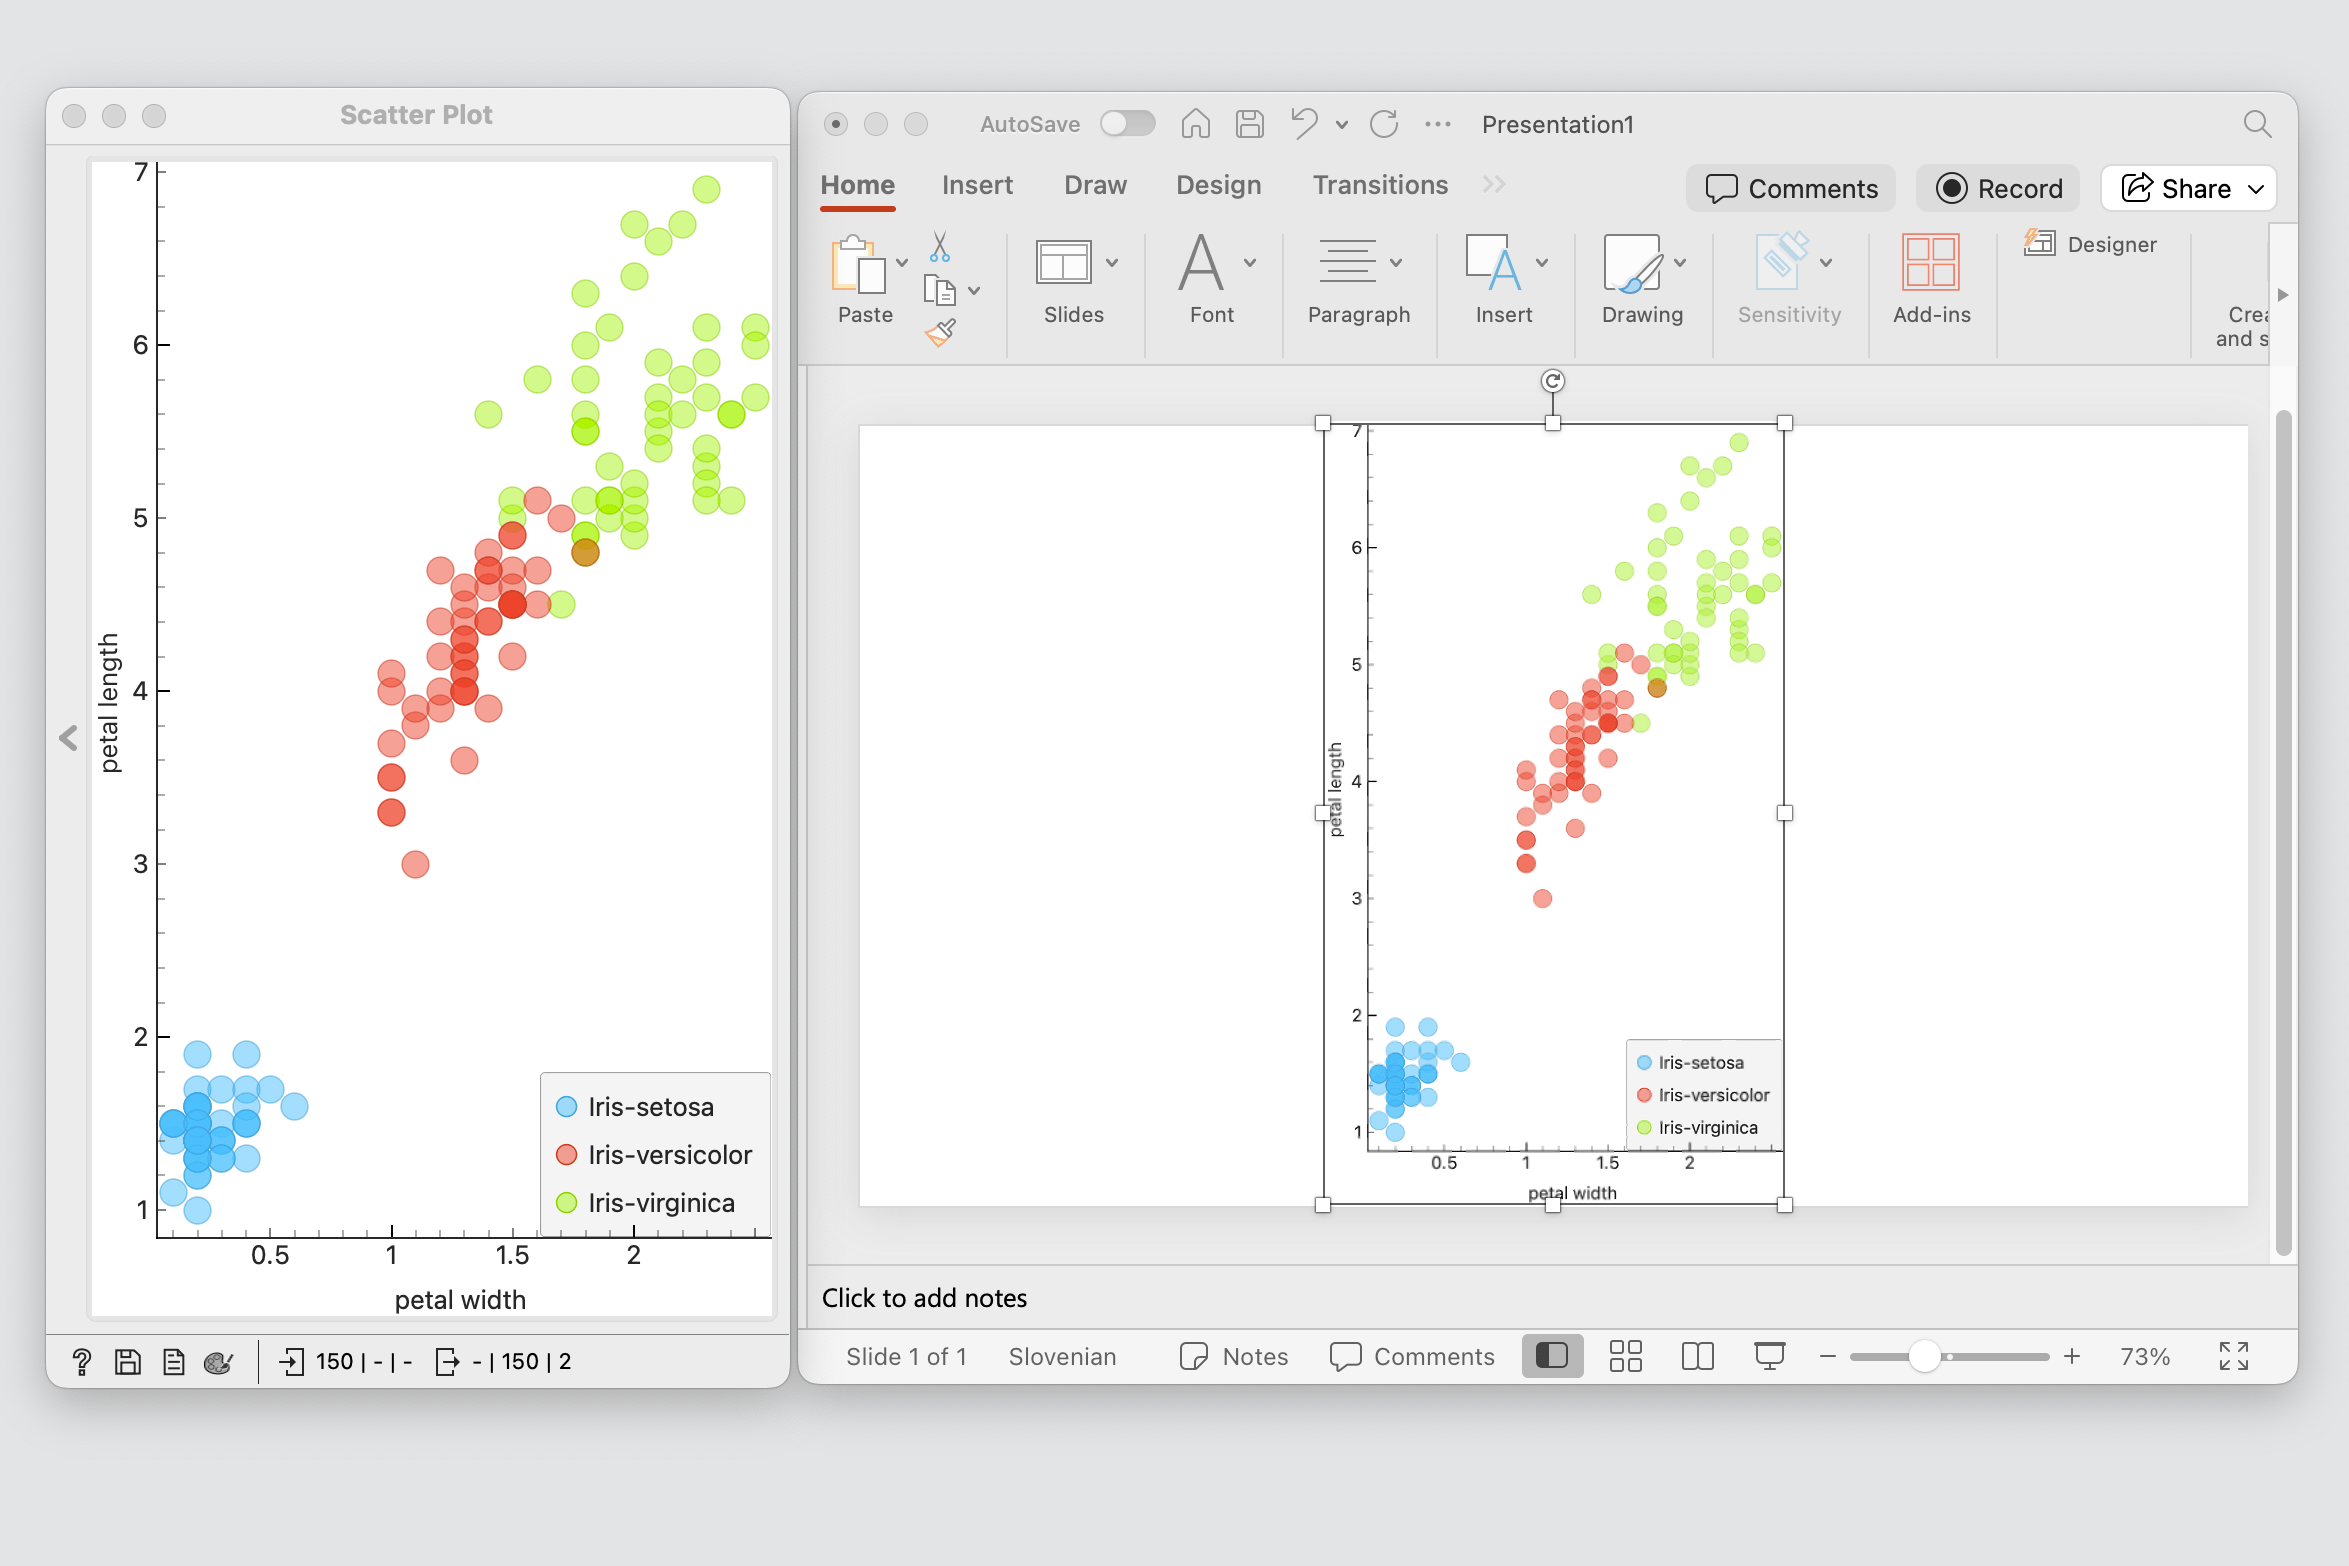
Data Mining Fruitful and Fun

Open source machine learning and data visualization.

Download Orange 3.38.1

Dec 03, 2024

Partial Least Squares in the Pharmaceutical Industry

Partial Least Squares (PLS) enhances pharmaceutical research by analyzing complex, high-dimensional datasets, addressing multicollinearity, and building predictive models. Orange streamlines its implementation for robust and innovative insights, driving innovation in pharmaceutical research.

Partial Least Squares in the Pharmaceutical Industry

Dec 02, 2024

Orange Is Becoming a Poliglot

Orange 3.38 supports switching between languages

Orange Is Becoming a Poliglot

Nov 21, 2024

Visualize bag of words?

We are used to seeing word clouds. How about a TF-IDF word cloud? Orange has a great way of observing TF-IDF results. Useful for the analysis and teaching!

Visualize bag of words?

Oct 23, 2024

Luxembourgish Teachers Experiment with Orange in Nature

How can Orange support the needs of teachers and children in the pedagogical process? In Luxembourg, Blaž Zupan and Janez Demšar carried out an experimental workshop with local primary school teachers to test some approaches.

Luxembourgish Teachers Experiment with Orange in Nature

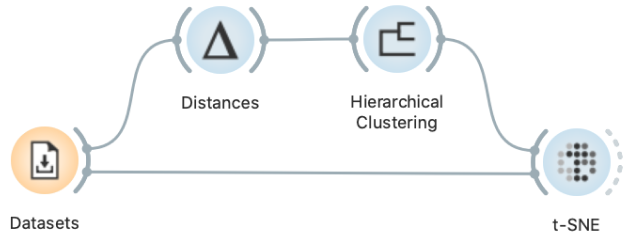
Visual Programming

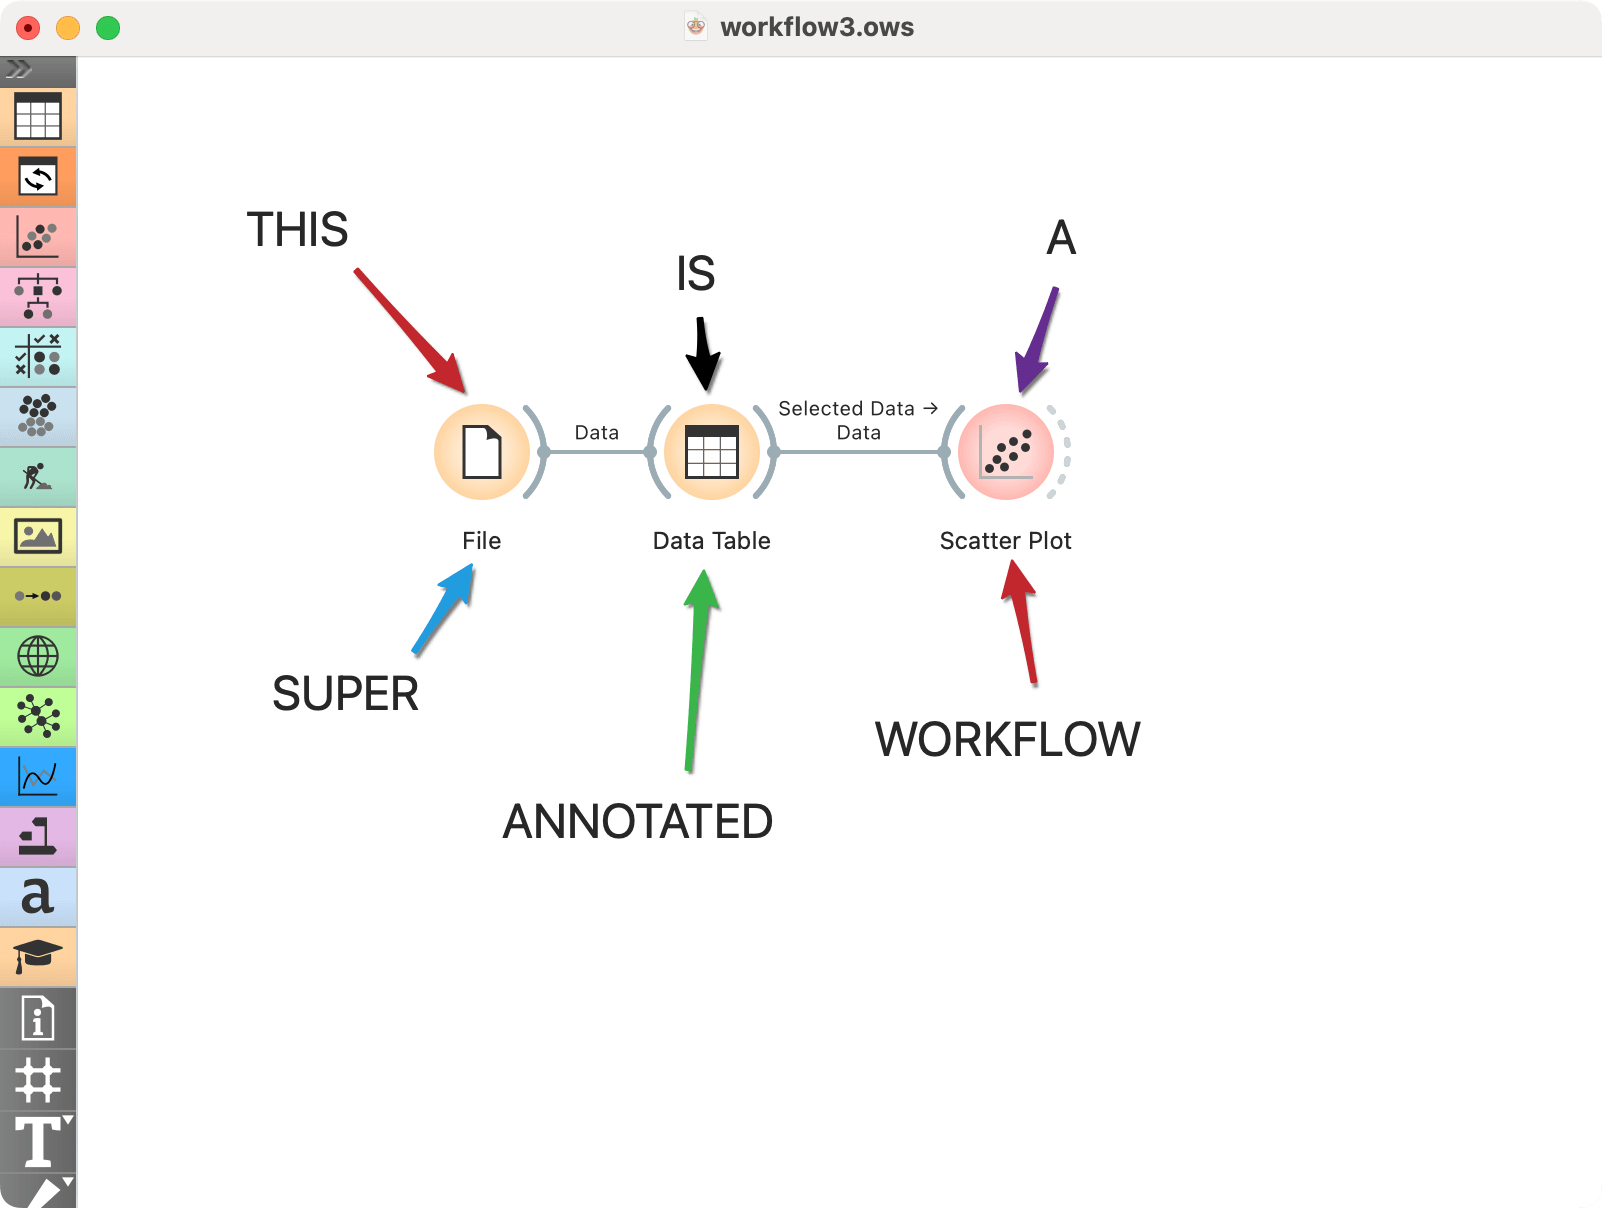
No coding needed. Place widgets on the canvas, connect them, load your datasets, and harvest the insight!

Learn moreWatch video
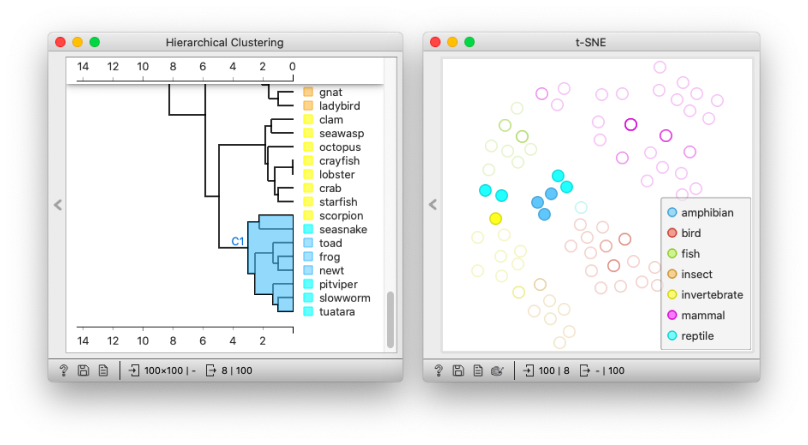
Interactive Data Visualization

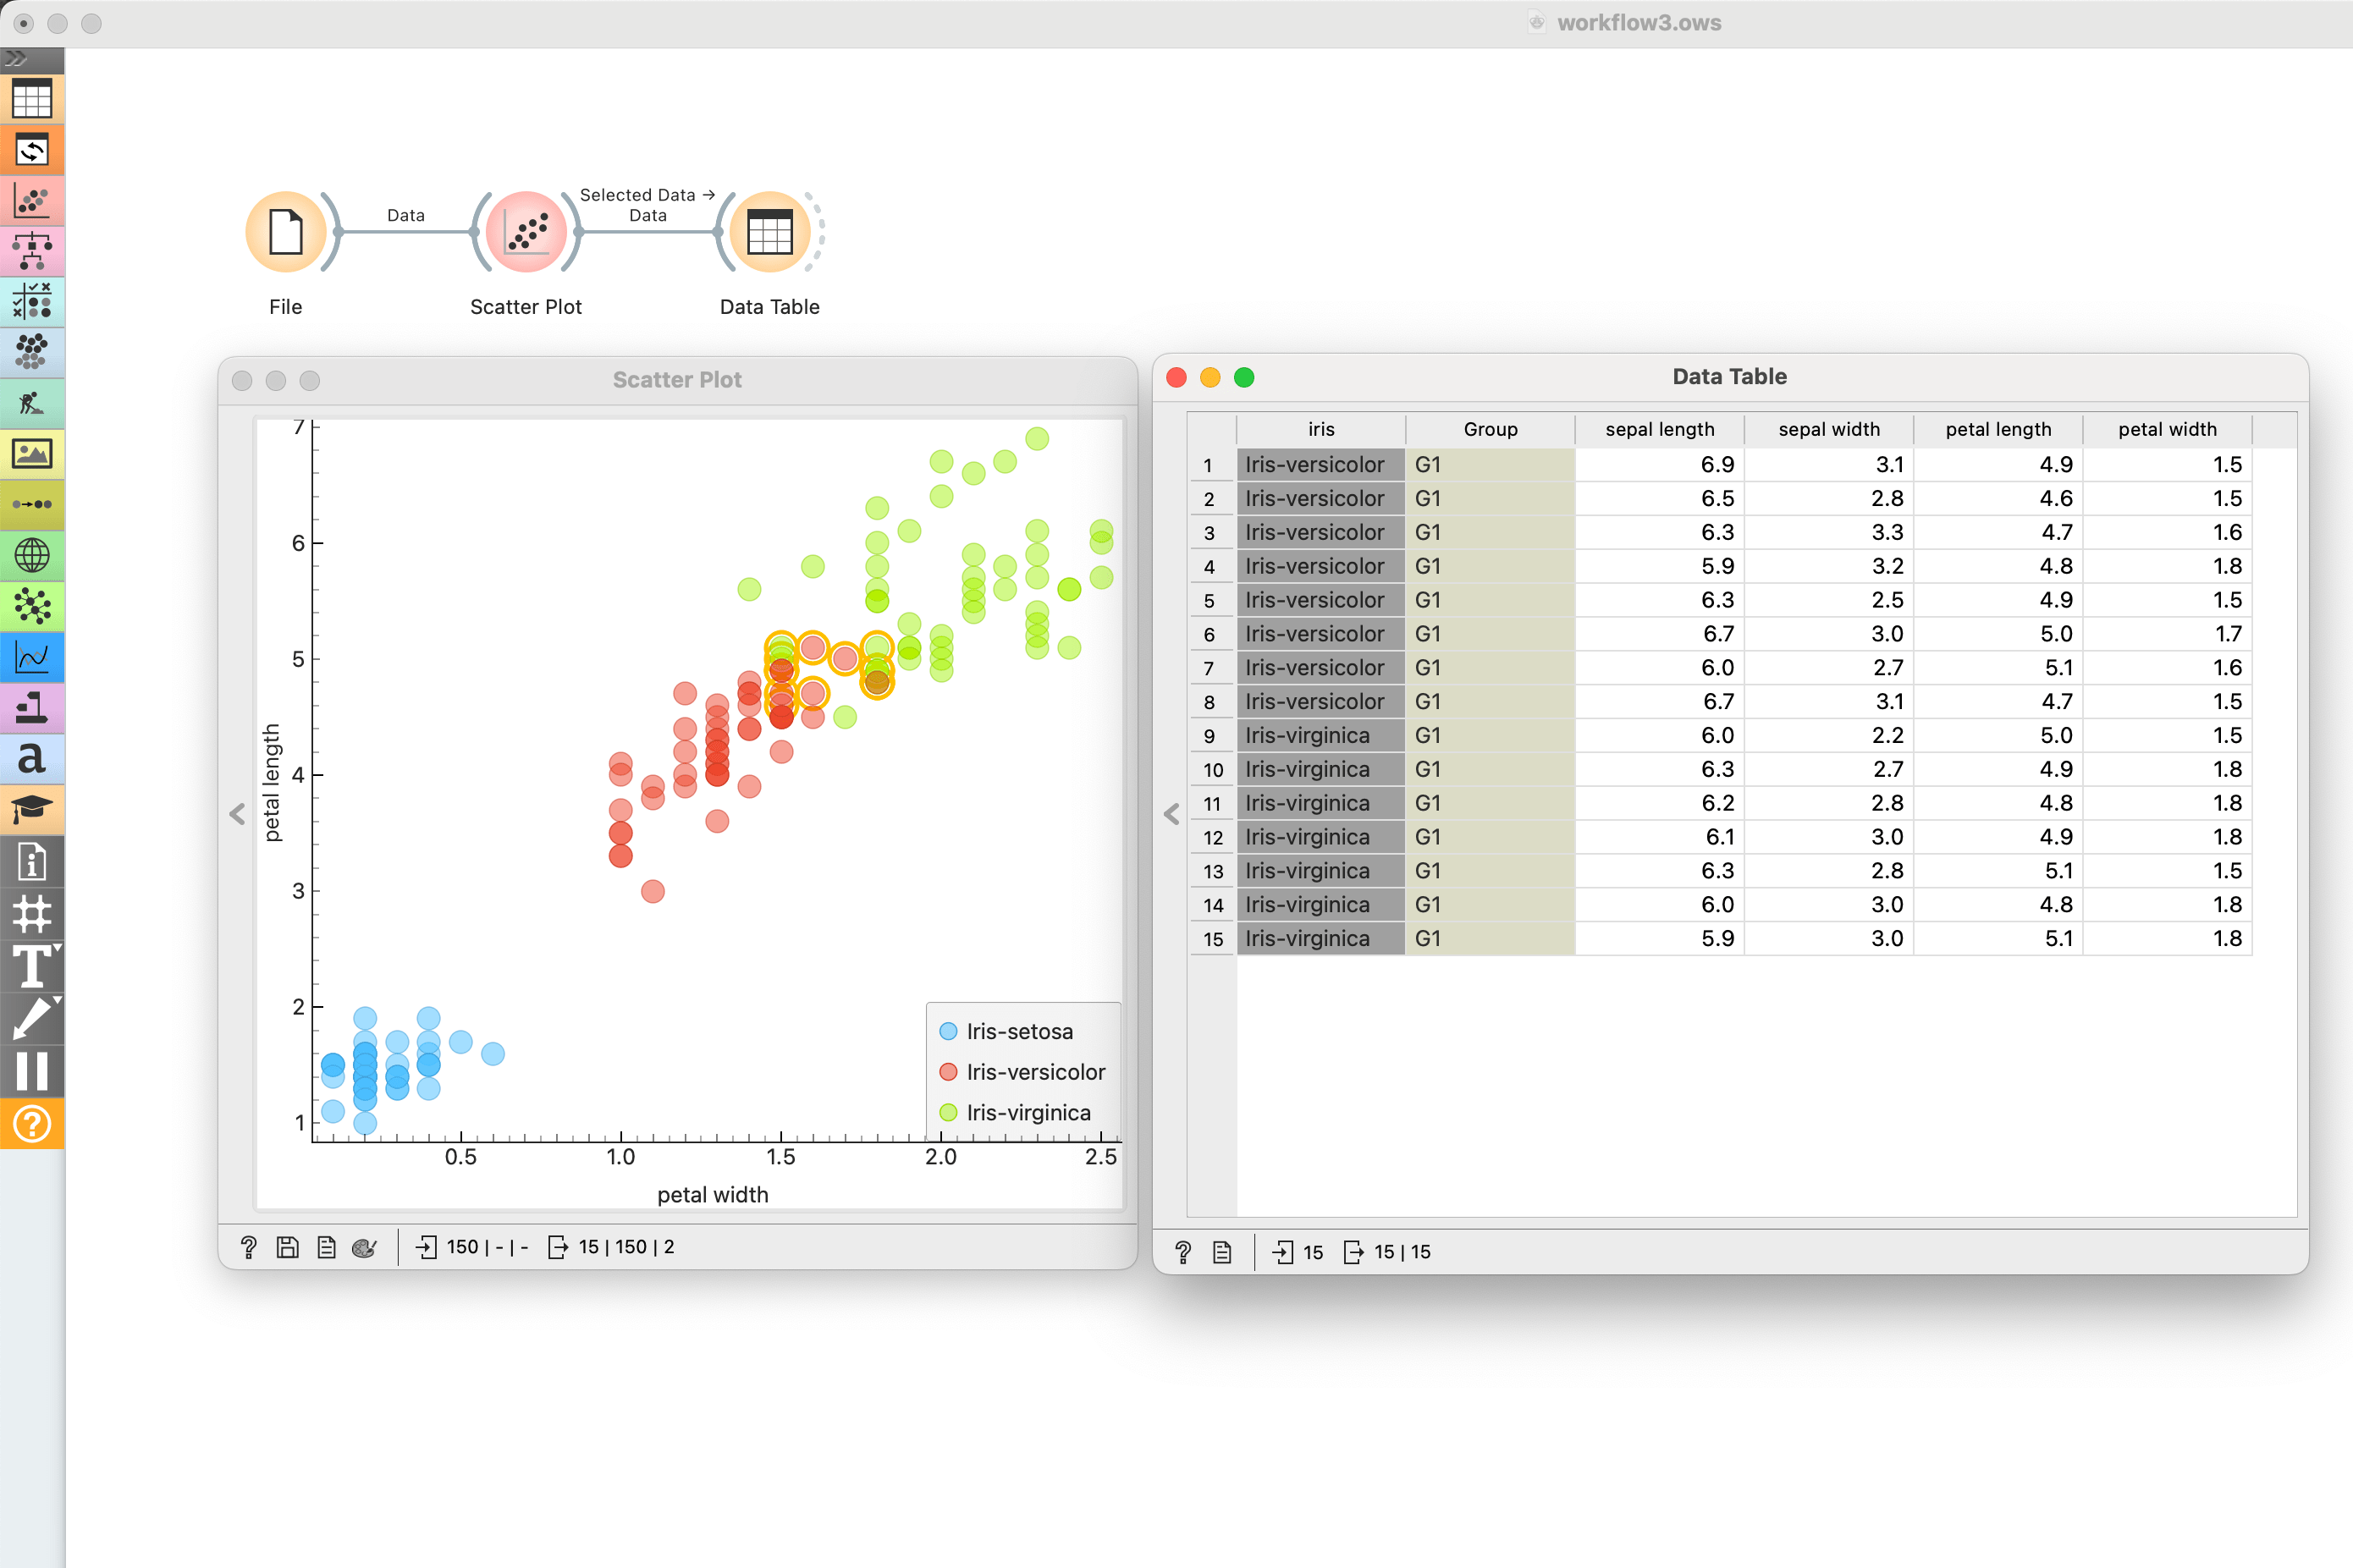
Explore statistical distributions, box plots and scatter plots, or dive deeper with decision trees, hierarchical clustering, heatmaps, MDS, t-SNE and linear projections. Even your multidimensional data can make sense.

Learn more
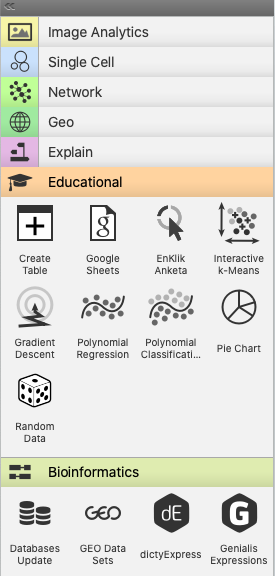
Extensions

Specialized add-ons can perform natural language processing and text mining, conduct network analysis, do association rules mining, or address fairness in machine learning. Some address specialized data, such as time series, survival data sets, spectra, or gene expressions. Also, check out Orange's cousin Quasar.

Watch video
Teach with Orange

When teaching data mining, we like to illustrate rather than only explain. And Orange is great at that. Used at schools, universities and in professional training courses across the world, Orange supports hands-on training and visual illustrations of concepts from data science. There are even widgets that were especially designed for teaching.

Learn more

My laboratory produces large amounts of data from RNA-seq, ChIP-seq and genome resequencing experiments.  Orange allows me to analyze my data even though I don’t know how to program.  It also allows me to communicate with my collaborators, who are experts in data mining, and with my colleagues and trainees.

Gad Shaulsky, Ph.D.

Molecular biologist and Director of Graduate Studies (Baylor College of Medicine, Houston, USA)

The scientific community is in need of tools that allow easy construction of workflows and visualizations and are capable of analyzing large amounts of data. Orange is a powerful platform to perform data analysis and visualization, see data flow and become more productive. It provides a clean, open source platform and the possibility to add further functionality for all fields of science.

Ferenc Borondics, Ph.D.

Principal beamline scientist at SMIS (SOLEIL synchrotron, France)

I teach Orange workshops monthly to a diverse audience, from undergrad students to expert researchers. Orange is very intuitive, and, by the end of the workshop, the participants are able to perform complex data visualization and basic machine learning analyses. Most of our attendees have been able to incorporate this tool in their research practice.

Francesca Vitali, Ph.D.

Research Assistant Professor (Center for Biomedical Informatics & Biostatistics, The University of Arizona)

Contribute to Orange

If you love using Orange and want to support us, a donation would be very much appreciated. The funds help us fix bugs, implement new features, provide free educational content, and maintain computational infrastructure.

Donate

This site uses cookies to improve your experience.