model explanation, explainable AI, explain, predictive modelling
Explaining Predictive Models
Ajda Pretnar
Feb 10, 2021
It is easy to build powerful predictive models in Orange. But how does the model "look like"? Which attributes and which values of those attributes are important? And when making predictions, which attributes contributed to the decision? Orange's new Explain add-on helps you answer all those questions.
Related: Explaining Models
Go to Options --> Add-ons and install Explain add-on. Restart Orange for the add-on to appear. It only contains two widgets, but boy are they great!
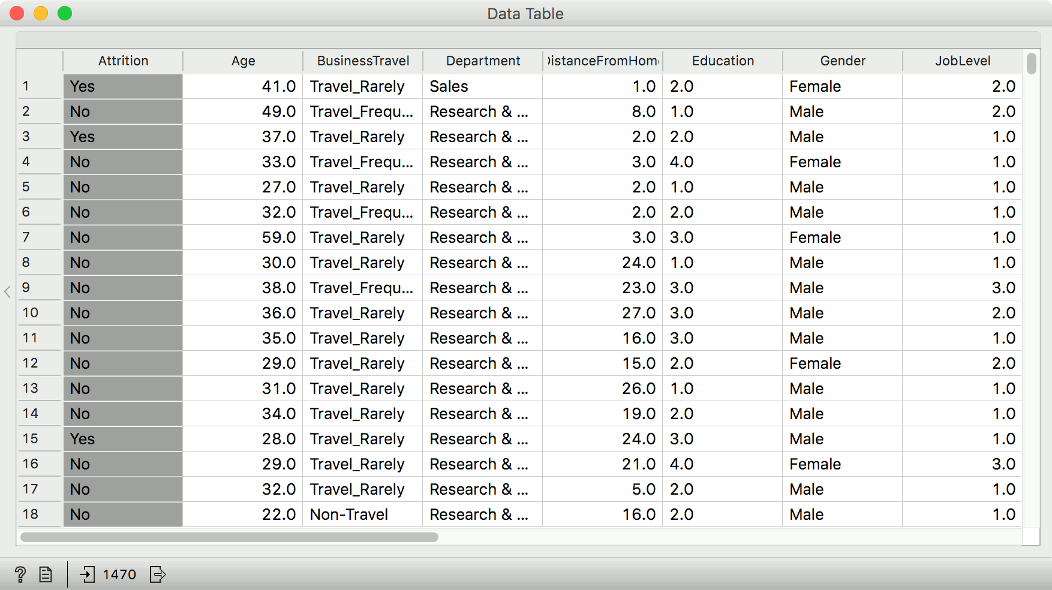
Let us start with the attrition data set from the Datasets widget. We will go with Attrition - Train, which a data set on which employees resigned from the company and which stayed. The target variable is called Attrition, where No means that the employee stayed and Yes that the employee resigned. The other attributes describe the employee - her position, education, department, years since promotion, and so on.
Next, we will build a simple logistic regression predictive model. If inspecting the model in Test and Score, we learn that the model has an AUC of 0.788 and 86 % CA. But what kind of a model is this? How does it makes its decisions?
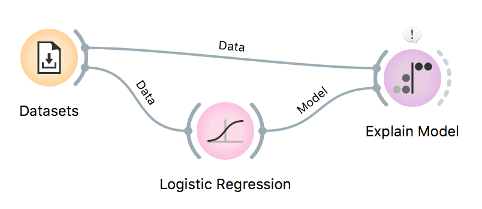
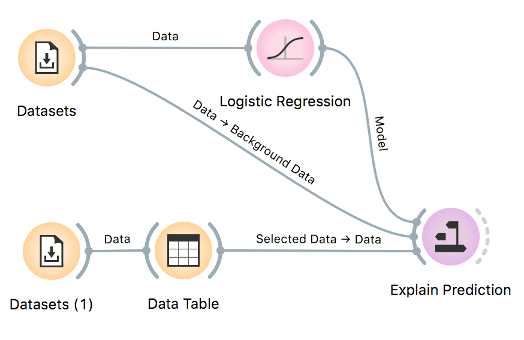
Let us add Explain Model to Logistic Regression and add another connection passing the data. The workflow should look like this:
Now open Explain Model. The widget lists top ranked variables, which means they contribute the most to the selected target variable. As we are trying to understand why people leave the company, we have set the target variable to Yes.
The highest ranked variable is OverTime - this is the variable with the highest impact on the prediction. Having a value Yes in the categorical attribute OverTime (red dots on the right) means the employee is likely to quit. Also, having low job satisfaction contributes to attrition (blue values on the right). The visualization shows the values which have a high impact on the prediction of the selected class on the right and those which vote against the selected class on the left. The color of dot represents the value of the attribute (red for higher values and blue for lower).
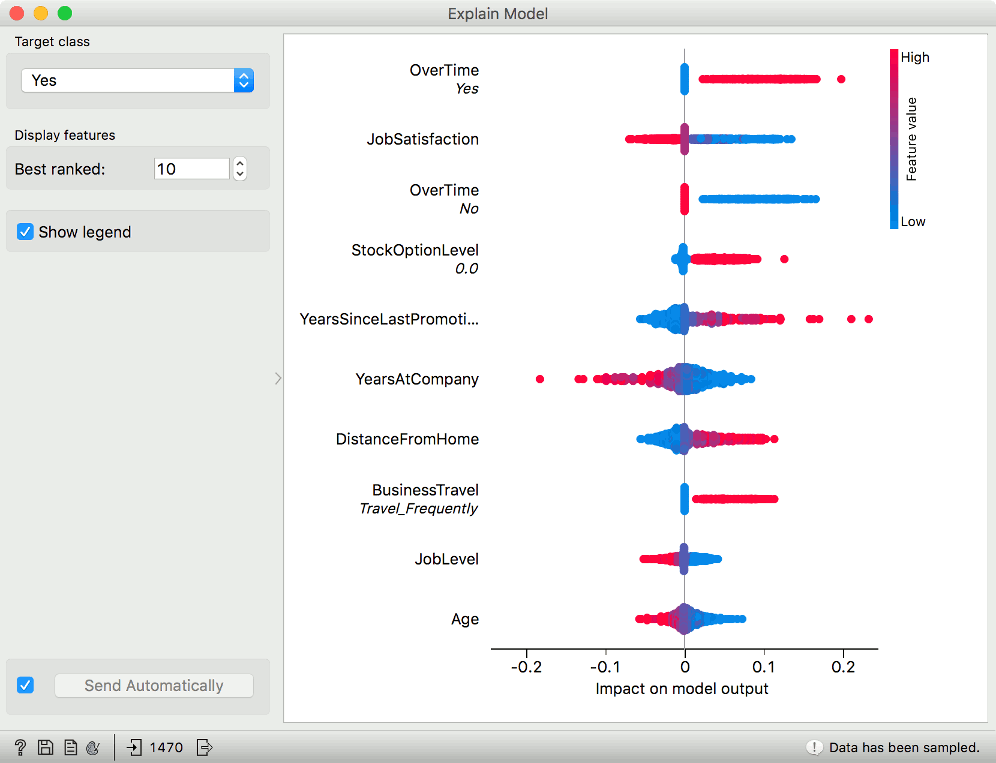
Let us look at, for example, YearsAtCompany. How would we interpret this? The variable has more red dots on the left, which means high variable values contribute against the target value (against attrition, i.e. employees will stay). Red dots refer to the value of the attribute. So if the employee is with the company for a long time (high value == red dot), it means it is more likely she will stay (dots are on the left, while our target value is Yes).
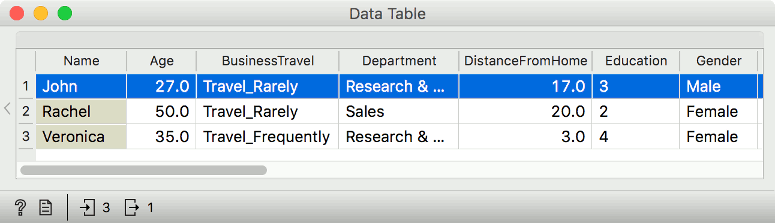
Great, now we understand the model and we are ready to make some predictions. Let us load Attrition - Predict with another Dataset widget. We have three new employees, who are described with all the previous variables, but they are lacking Attrition - we do not know, who is more likely to leave.
Now pass the logistic regression model and the train data set to Explain Predictions. Then select John from the table and pass the selection to Explain Predictions. The widget requires three inputs: the model, training data, and the instance we are predicting (John).
Once again, we are interested in target value Yes. Variables in red increase the probability of the target value (conversely, blue decrease it). The size of the arrow corresponds to the SHAP value - in other words, the larger the arrow the larger the variable's contribution to the target value. The model also predicted that John will leave the job with 77 % probability.
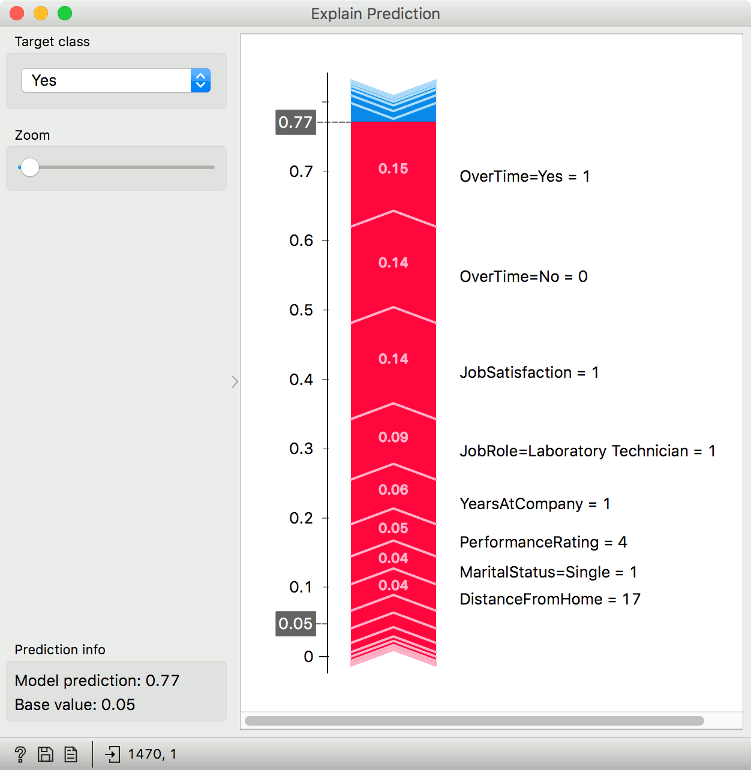
As before, the most important variable for John is overtime. Him working overtime contributes a lot to the final prediction. Also, his job satisfaction is low (1 out of 5), making him likely to quit.
The results correspond very much to those of the model, but it might not always be the case. Some people might leave because they are very dissatisfied without working overtime. This would show in Explain Predictions. See how the results change for the other two employees, Rachel and Veronica. Or make up your own employee with Excel and see what would the prediction be.