workshop, belgrade, classification, nomogram, naive bayes, decision tree
Explaining Models: Workshop in Belgrade
Ajda Pretnar
Nov 20, 2019
On Monday, Blaž and I held a technical tutorial Data Mining through Visual Programming and Interactive Analytics in Orange at this year's edition of Data Science Conference in Belgrade, Serbia. The tutorial explained how to quickly prototype standard data mining and machine learning workflows in Orange and how to interactively explore clustering and classification models. The final part raised an interesting question that we're going to explore in continuation.

\
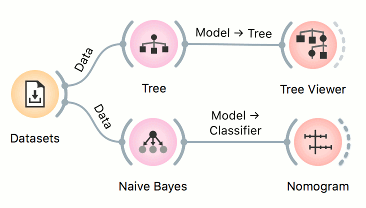
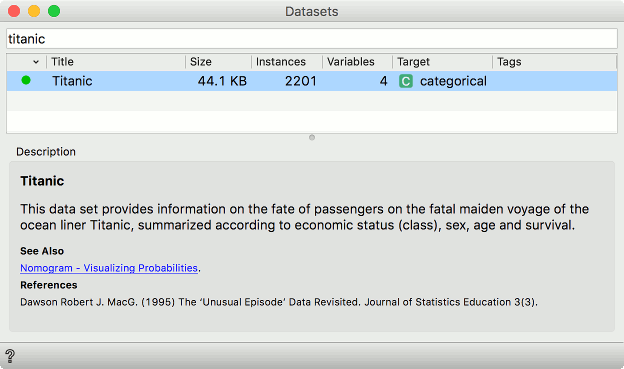
First, let us load the titanic data with the Datasets widget. The data is a simplified version of Kaggle's Titanic data set. Instead of 10 variables, we kept just 4 - gender (male or female), age (adult or child), status (first, second, third or crew) and the survival class label (yes or no).
\
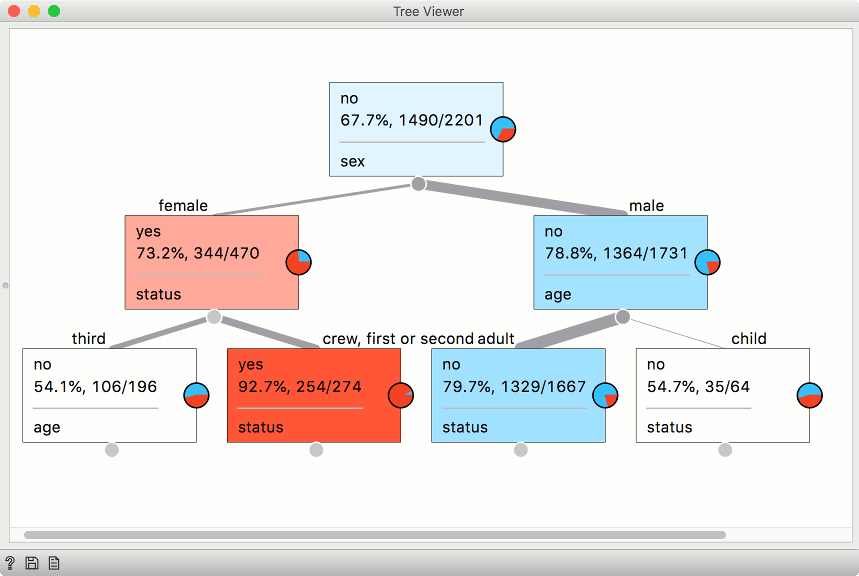
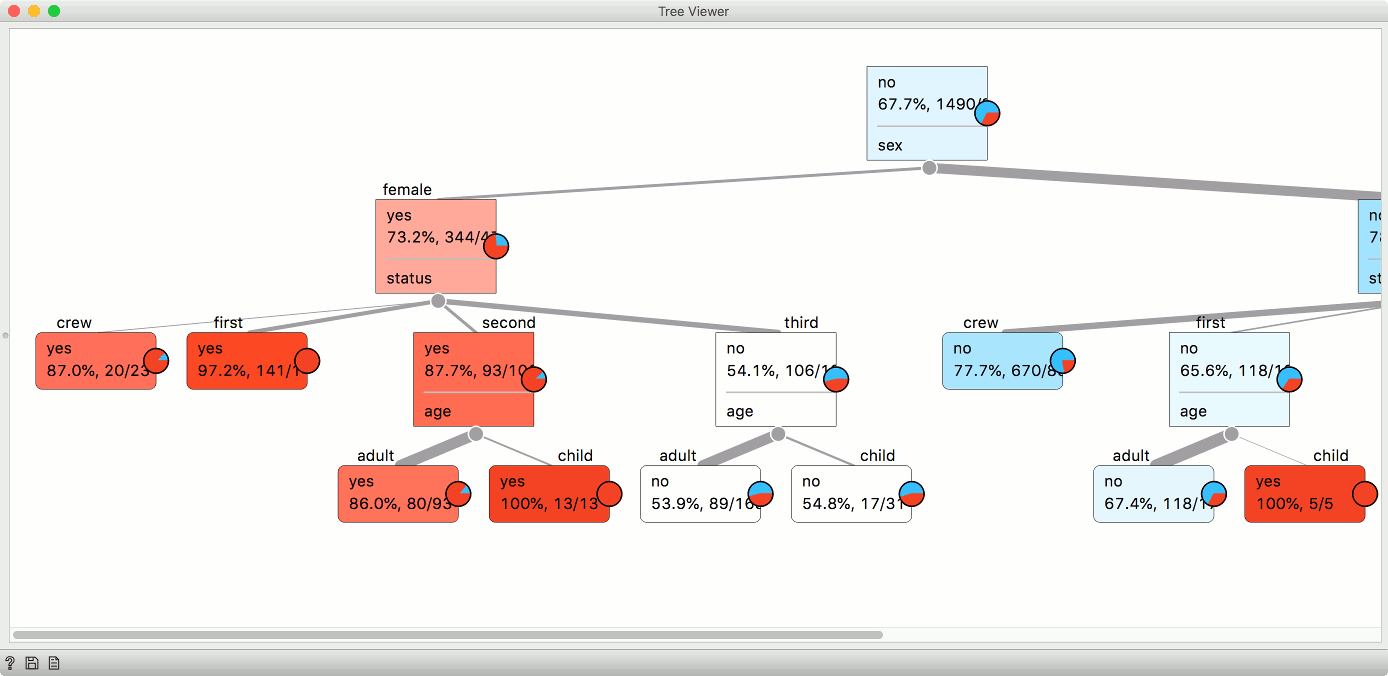
Let us build a simple decision tree model with a Tree widget and observe it in a Tree Viewer. I have hidden the bottom branches for simplicity. Let us observe, what gives me the highest probability of survival. Seems like it is best if I travel as female in the first or second class or as a member of the crew. This would give me 92% chance of surviving the trip.
\
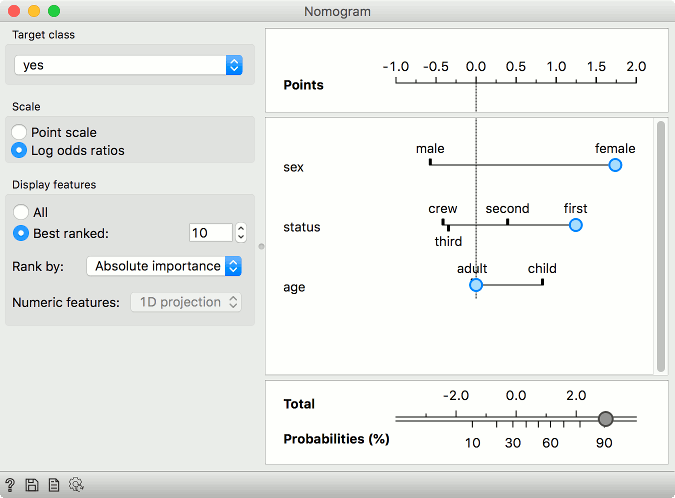
Ok, what about another classifier. Let's say Naive Bayes. Connect Naive Bayes to Datasets and then Nomogram to Naive Bayes. It seems like I have the best change of surviving the trip if I travel as female in the first class - the chance of surviving is 90%. But why does Naive Bayes say it is bad to travel as a female crew member, while Tree says it is ok?
\
First, Naive Bayes does not say it is bad to travel as a female crew member. Naive Bayes assumes attribute independence, so it does not claim anything about being a female AND a member of the crew. It just says it is better to travel as a female and not so good if you are a member of the crew.
Second, if we observe the parameters of the Tree classifier, we see that we asked for a binary tree. So inevitably the variables will fall into two categories - third class (which has a low chance of survival) and everything else. If we uncheck this box, we see that the probability of surviving for female crew is slightly lower - 87%. That is still not too bad, but note that we only have 23 instances for this branch! There were not many female crew members on Titanic, so a sample is fairly small compared to other status values.
\
The key message of this part of the tutorial was that different models work differently and we have to understand what they are telling us and how they were constructed. Luckily, Orange enables us to explore certain models, so we can inspect them and draw conclusions from the best ranked attributes.