Feature Importance
Inspect model using the Permutation Feature Importance technique.
Inputs
- Data: dataset used to compute the explanations
- Model: a model which widget explains
Outputs
- Selected data: data instances that belong to selected features in the plot
- Scores: Mean and standard deviation of score for each feature.
Feature Importance widget explains classification and regression models. The widget gets a trained model and reference data on input. It uses the provided data to compute the contribution of each feature toward the prediction, by measuring the increase in the prediction error of the model after we permuted the feature's values, which breaks the relationship between the feature and the target.
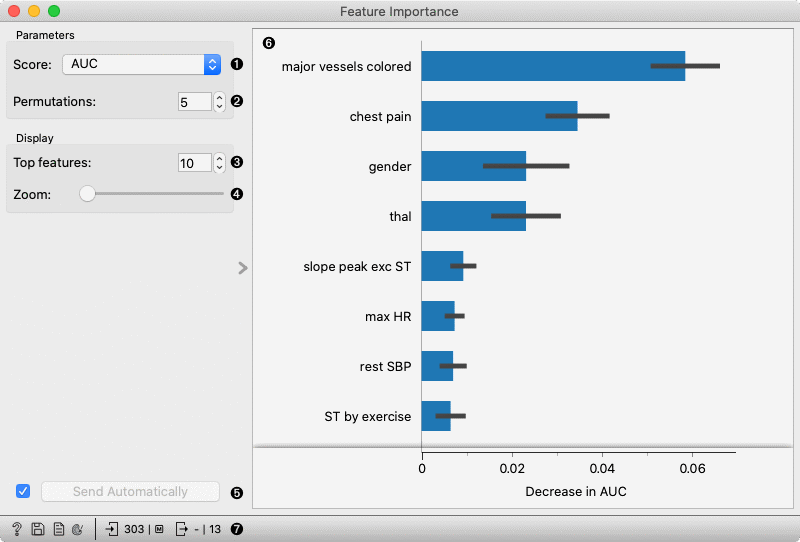
- Select the scoring metric.
- Select the number of times to permute a feature.
- Select the number of the features to be shown in the plot.
- Zoom in/out the plot.
- Press Apply to commit the selection.
- Plot which shows the selected number of features that are most important for a model.
- Get help, save the plot, make the report, set plot properties, or observe the size of input and output data.
Example
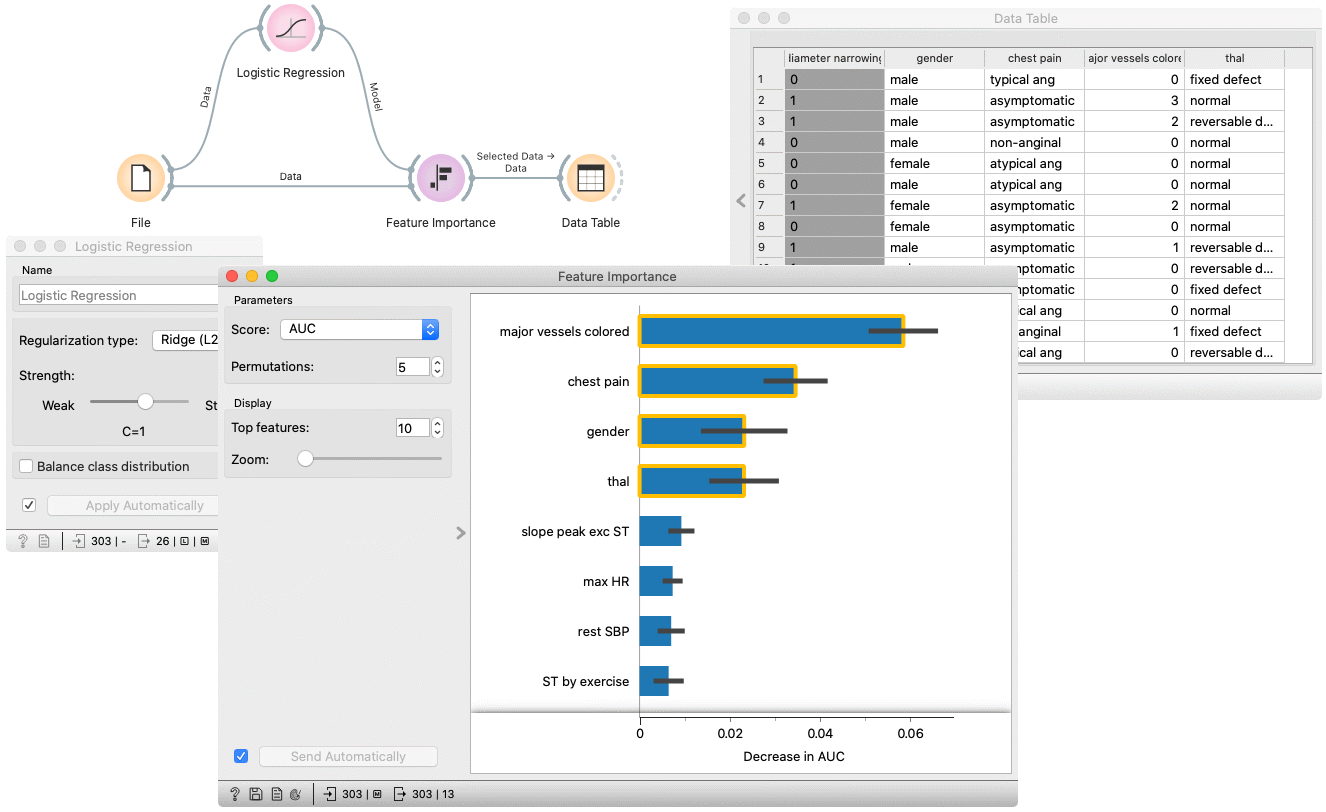
In the flowing example, we use the Feature Importance widget to explain features, used in Logistic regression model. In the File widget, we open Hearth disease dataset. We connect it to Logistic regression widget, which trains the model. Feature Importance widget accepts the model and data which are used to explain the features. For an explanation, we usually use the same data than for training, but it is also possible to explain the features on different data (e.g. reference data subset).
The features in the plot are ordered by their relevance (e.g. Major vessels coloured is the most important feature).
By selecting some arbitrary features, a filtered input dataset appears on the output of the Feature Importance widget.