conference, education, orange3
Orange at Eurostat's Big Data Workshop
BLAZ
Nov 02, 2016
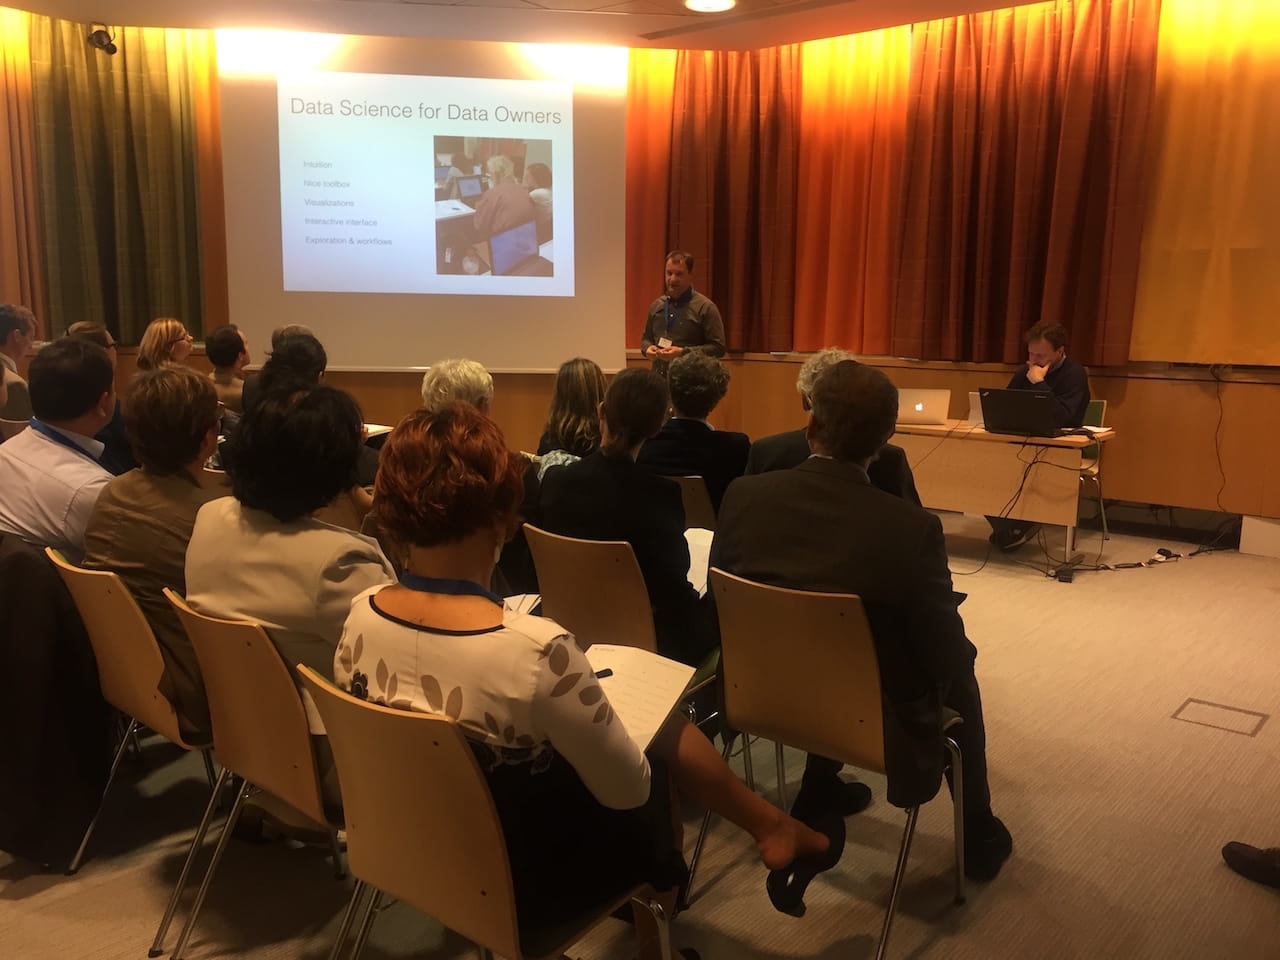
A Eurostat's Big Data Workshop recently took place in Ljubljana. In a presentation we have showcased Orange as a tool to teach data science.
The meeting was organised by Statistical Office of Slovenia and by Eurostat, a Statistical Office of the European Union, and was a primary gathering of representatives from national statistical institutes joined within European Statistical System. The meeting discussed possibilities that big data offers to modern statistics and the role it could play in statistical offices around the world. Say, can one use twitter data to measure costumer satisfaction? Or predict employment rates? Or use traffic information to predict GDP?
During the meeting, Philippe Nieuwbourg from Canada pointed out that the stack of tools for big data analysis, and actually the tool stack for data science, are rather big and are growing larger each day. There is no way that data owners can master data bases, warehouses, Python, R, web development stacks, and similar. Are we alienating the owners and users from their own sources of information?
Of course not. We were invited to the workshop to show that there are data science tools that can actually connect users and data, and empower the users to explore the data in the ways they have never dreamed before. We claimed that these tools should
- spark the intuition,
- offer powerful and interactive visualizations,
- and offer flexibility in design of analysis workflows, say, through visual programming.
Related: Teaching data science with Orange
We claimed that with such tools, it takes only a few days to train users to master basic and intermediate concepts of data science. And we claimed that this could be done without diving into complex mathematics and statistics.

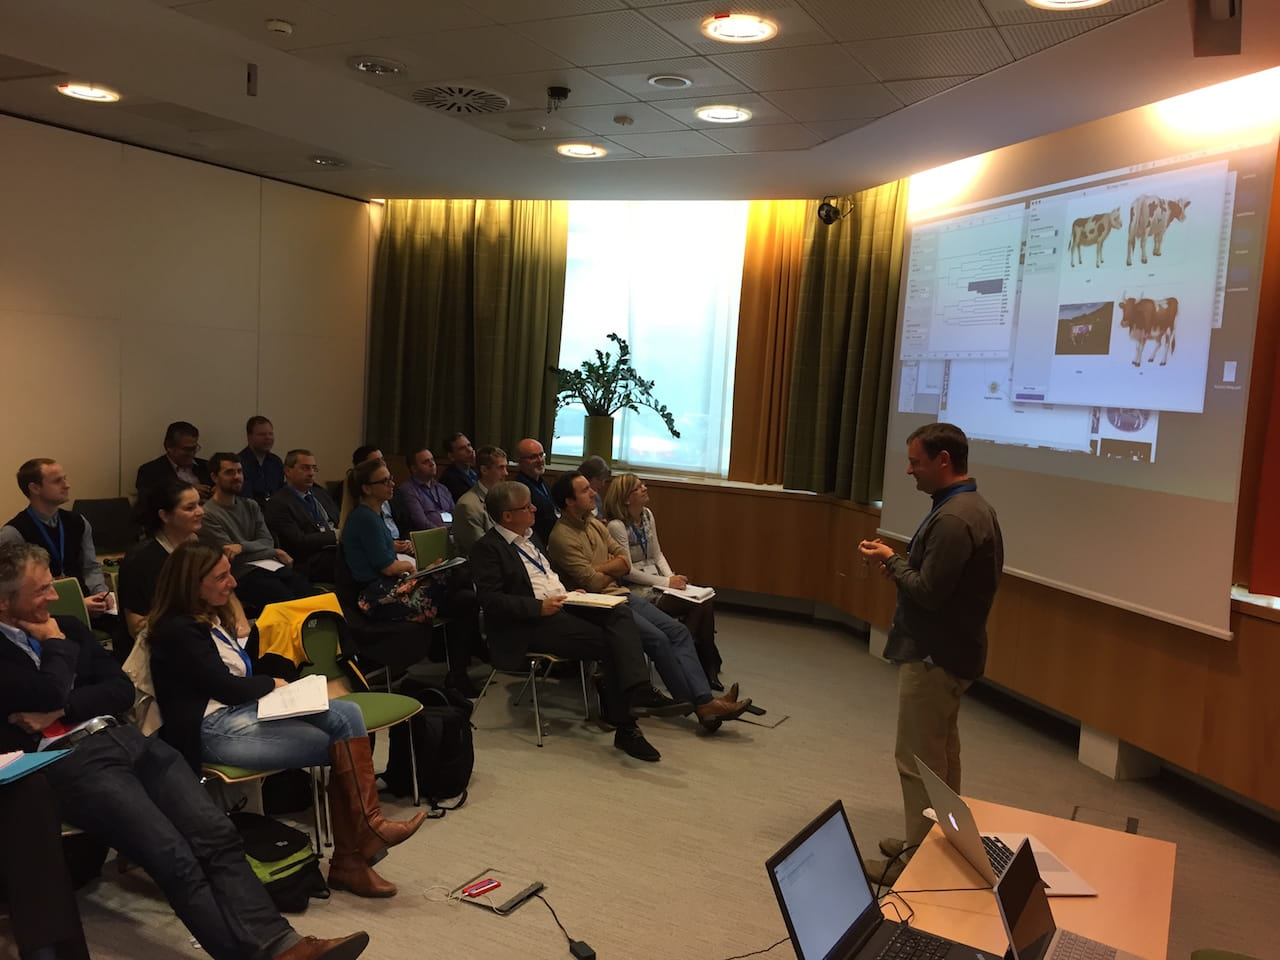
Part of our presentation was a demo in Orange that showed few tricks we use in such training. The presentation included:
- a case study of interactive data exploration by building and visualizing classification tree and forests, and mapping parts of the model to the projection in a scatter plot,
- a demo how fun it is to draw a data set and then use it to teach about clustering,
- a presentation how trained deep model can be used to explore and cluster images.
Related: Data Mining Course at Baylor College of Medicine in Houston

The Eurostat meeting was very interesting and packed with new ideas. Our thanks to Boro Nikić for inviting us, and thanks to attendees of our session for the many questions and requests we have received during presentation and after the meeting.