analysis, bioinformatics, Foundation Models
Foundation models in Orange with just a few lines of code
Martin Špendl
Jan 20, 2025
Foundation models are becoming a necessary addition to our toolbox, especially in fields like biomedicine. A large community of researchers is developing these models, so you don’t have to! Improved versions of models are uploaded almost by the minute on repositories like Hugging Face. The following blog/tutorial will show you how to use models from Hugging Face in Orange with just a bit of coding. Fear not; you will be only required to write a few lines in the Python Script widget, and you will unlock the full power of foundation models. Let’s begin!
What You’ll Need
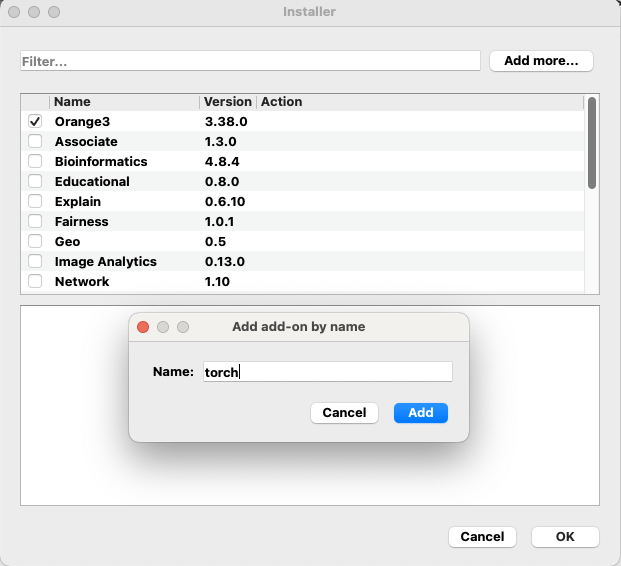
Before we get started, make sure you’ve got Orange installed on your computer. You’ll also need two Python packages: torch and transformers. To install these packages, open Orange, navigate to Options and select Add-ons. In the upper right corner, click Add more… and type torch. Once you can see the package in the list of add-ons, check the square and press OK on the bottom left corner of the window. This procedure will install the package torch in your Orange application. Use the same procedure for the transformers package. You will only have to do this once. You can quickly check if your installation was successful by opening the Python Script widget, typing in the console: import transformers, and pressing Enter. If there is no error, the installation was successful.

A Biology Problem: Grouping Proteins by Their Structure
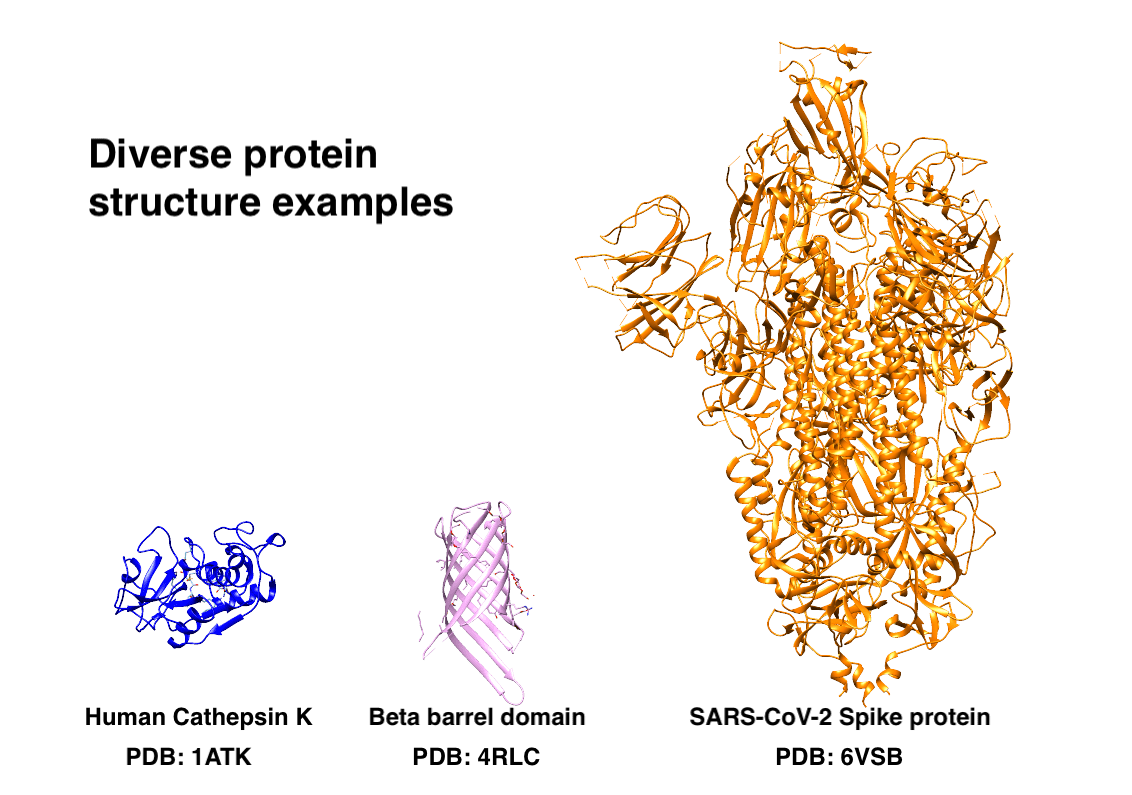
Proteins are long chains of amino acids that fold into 3D structures, determining their function. These protein stuctures can vary from small and globular (Cathepsin K), highly structured (transmembrane beta barrel), to large and multimeric structures, for example Spike protein of SARS-CoV-2. Determining their structure was, until recently, a very tedious task and sometimes even nearly impossible. Nowadays, large foundation models can infer protein structure from just their amino acid sequence, and we will use one of those models in our analysis.

Our goal here is to group human proteins with similar structures—without comparing their actual structure! We’ll turn protein sequences into numbers (embeddings) using the ESM-2 model from Hugging Face. These embeddings capture patterns hinting at structural similarities and are thus easier to compare than structures. Later, we will try to identify groups of proteins with similar structures.
Step 1: Creating ESM-2 Embeddings
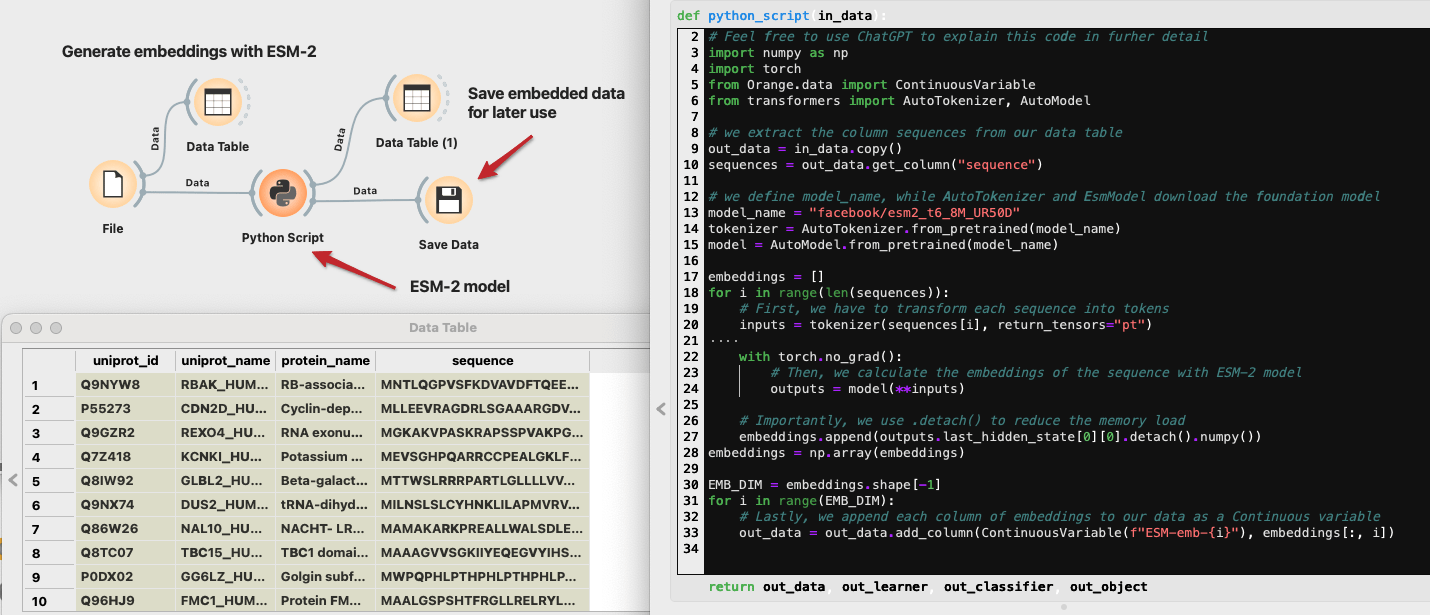
We will work with a subset of 5000 human proteins downloaded from the UniProt. You can download this CSV file, where we processed the downloaded FASTA file. We kept 5000 random proteins with sequence lengths between 100 and 1500 amino acids. The longer the sequence, the more computation resources the model will require. We can easily load this file into Orange with the File widget. The Data Table widget shows that aminoacid sequences are stored in the "sequence" column.
We will now use a protein foundation model from Meta called ESM-2. Visit the Hugging Face website to inspect the model. ESM-2 comes in different sizes, from 8M to 15B parameters. We will use the smallest version to save computation time, but feel free to upgrade the model. To find foundation models in general, you can search through Hugging Face. Copy the model’s name on the top of the page (e.g., "facebook/esm2_t6_8M_UR50D") and return to Orange.
Open a Python Script widget and copy the code below inside the python_script function. Let’s quickly go through what it does. First, it imports the necessary packages like numpy and torch. Then, we fetch sequences from our in_data, which is a DataTable on the input of the Python Script widget. The next three lines are where we define our foundation model, in our case, the "facebook/esm2_t6_8M_UR50D". Tokenizer is used to transform our sequence into tokens, the language of the model. Lastly, we define the model itself with the EsmModel class. Note that if you use another foundation model (e.g., DNABert), you only need to change the variable ‘model_name.’ In the following steps, we iterate through sequences, using the tokenizer and the model to extract the protein embedding on the output. The last for loop goes through protein embeddings and appends each column to our data table. Finally, we output the resulting table with protein embeddings as columns.
# import necessary packages and classes
# Feel free to use ChatGPT to explain this code in furher detail
import numpy as np
import torch
from Orange.data import ContinuousVariable
from transformers import AutoTokenizer, AutoModel

# we extract the column sequences from our data table
out_data = in_data.copy()
sequences = out_data.get_column("sequence")

# we define model_name, while AutoTokenizer and EsmModel download the foundation model
model_name = "facebook/esm2_t6_8M_UR50D"
tokenizer = AutoTokenizer.from_pretrained(model_name)
model = AutoModel.from_pretrained(model_name)

embeddings = []
for i in range(len(sequences)):
    # First, we have to transform each sequence into tokens
    inputs = tokenizer(sequences[i], return_tensors="pt")

    with torch.no_grad():
        # Then, we calculate the embeddings of the sequence with ESM-2 model
        outputs = model(**inputs)

    # Importantly, we use .detach() to reduce the memory load
    embeddings.append(outputs.last_hidden_state[0][0].detach().numpy())
embeddings = np.array(embeddings)

EMB_DIM = embeddings.shape[-1]
for i in range(EMB_DIM):
    # Lastly, we append each column of embeddings to our data as a Continuous variable
    out_data = out_data.add_column(ContinuousVariable(f"ESM-emb-{i}"), embeddings[:, i])
NOTE: Executing this code might take a few minutes up to an hour depending on your computational resources!

Let’s inspect what our table looks like now. In addition to our protein data, there are 320 columns representing the embedding. These values do now have meaning on their own, but we will see how to extract some information out of them shortly. Since the computation of embeddings took quite some time, let’s store the data first, before doing any further analysis.
Step 2: Visualizing Embeddings with t-SNE
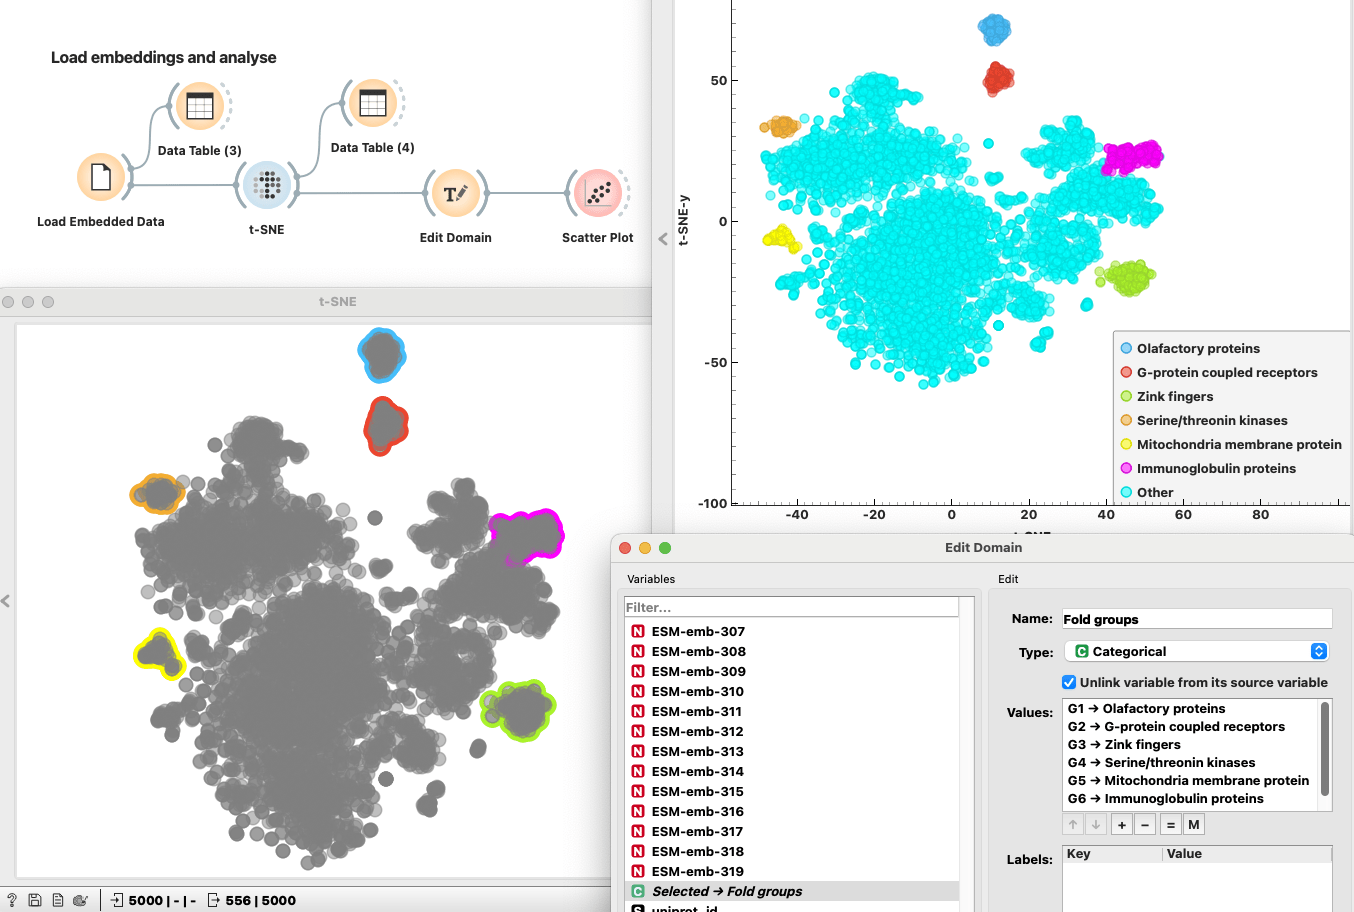
Now that we have the embeddings, let’s make sense of them visually. Using a t-SNE plot, we’ll turn these high-dimensional numbers into a simple 2D scatter plot. This makes it easy to spot clusters of proteins with similar structures. Even proteins without known structures can find their place in these clusters, helping us discover hidden relationships between them. If you want to inspect any of these groups, select them on the plot while holding the Shift key. We can inspect proteins in each group in the DataTable and change their group label to something more meaningful. Lastly, we can see different groups of proteins with respect to their structures, even though we did not have to compare any structures at all. Isn’t that amazing?

Wrapping Up
Foundation models paired with tools like Orange open up a world of possibilities on how to analyze complex data. This post is meant to introduce you to how we can use Hugging Face foundation models using a Python Script widget. It might seem a bit involved at first, but with a bit of help from ChatGPT, you can be using the latest cutting edge foundation models in no time.