data mining, statistics, climate data
Data tells stories; statistics shuts your mouth
Janez Demšar
Apr 20, 2025
I want to tell you about some interesting things we did at a recent workshop. At the same time, it made me think about how we should — and should not — teach data literacy and data mining.
A chance encounter
Before giving a workshop at a recent conference for Slovenian teachers, I had a chance meeting with... well, a meeting so brief that I perhaps misjudged the person I was talking to. Let us therefore, without loss of generality, assume it was an imaginary person, a fictional zealot, a guardian of statistical orthodoxy. You know, the kind of person who believes that the only way to the Truth leads through the sacred Ritual of forming the hypothesis, collecting the data, doing the sacred p-value dance (presumably after assuming the assumptions), rejecting the null hypothesis, and concluding with the necessary post-hocs.
The thing that stayed with me, though, was their shiver of horror when I mentioned "outliers," and being berated like a schoolchild that this is something you should never, ever do. (Do — what? Say the word outlier?) I then tried to explain what we plan to teach in schools and happened to mention clustering. I was told there are different clustering methods (well, I implemented many of them in Orange), but... really, "you want to teach clustering in schools"?!
It was not very pleasant. As said, I might have misjudged the person, but the image of a statistician on a high pedestal preaching the Proper Way stuck. But we'll get back to it later.
Interlude: A Workshop that didn't begin
My workshop was supposed to be a hands-on session on mining the Human Development Index (HDI) data. It turned out that there were no desks, the participants had overlooked the instruction to bring their own laptops, and the few who had them hadn't installed Orange. I asked them to install it, and in the meantime, I tried to entertain them with some things I had just been showing to a few people earlier.
Cluster analysis of countries by blood groups
It was a hierarchical clustering of countries based on the blood group distribution: the proportion of a country's population having the A+, A-, B+, B-, AB+, AB-, O+ or O- group.
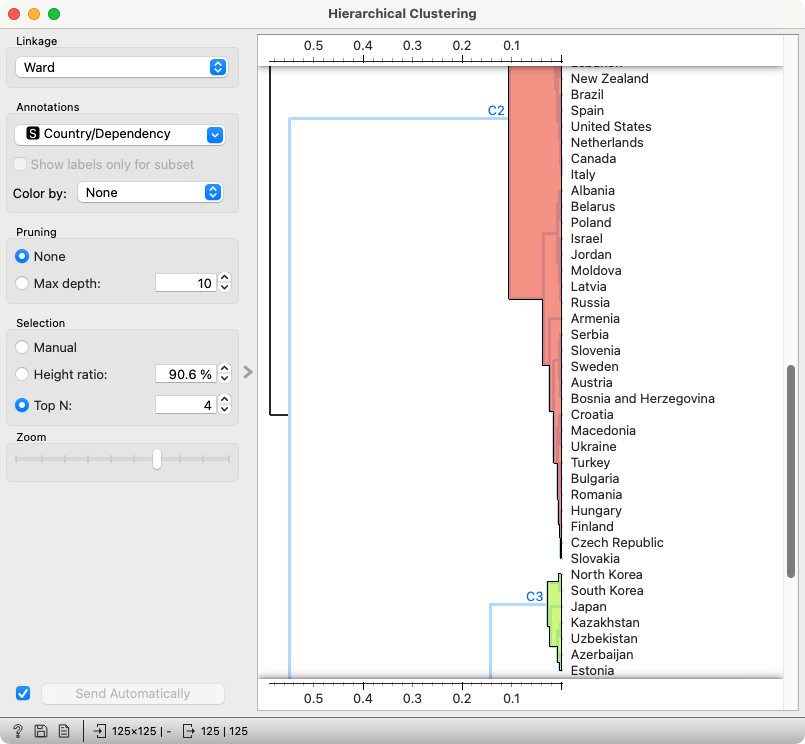
Have you noticed Israel close to Poland, Belarus, and Russia? We noticed it, too — and recognized that many of the current inhabitants of Israel came from Poland, Belarus, and Russia after the war.
North and South Koreans having similar blood groups is no surprise. Kazakhs, Uzbeks, and Azeris are Turkic peoples. Why are they close to Koreans, and what are the Japanese and Estonians doing here? I don't know enough history; it could be anything from Stalin's deportations to the Mongols spreading their genes during their invasions.
There's something interesting going on closer to my home. Czechs and Slovaks have very similar blood groups, which is not surprising. Hungarians and Finns, on the other hand, split thousands of years ago and, despite linguistic similarity (which is more about phonetics than vocabulary!), the Hungarian gene pool was enriched by Slavs, Germans, and Avars, and the Finnish by Scandinavians and Balts. It is pretty amazing that they still have similar blood groups.
But why are Czechs and Slovaks so close to Hungarians and Finns? My theory would be that Hungarians mixed with Slovaks and Czechs during the times of the Austro-Hungarian Empire. Let us also not forget that Hungary was on the wrong side in WW1 and WW2, for which it was punished by losing a lot of territory, including parts that went to Slovakia but were inhabited by ethnic Hungarians. The genetic pool of Slovakia thus includes a lot of Hungarians.
Can we make any conclusions from this? Surely not. But it's interesting to dig into this, explore the possible reasons, perhaps combine it with other publicly available data (eye color?)... At the end of the day, the data is what it is, and we can only list the possible reasons.
Interlude: Do you have the Orange-Geo add-on?
At this point, I asked those who were installing Orange whether they were done, and to please also install the Orange-Geo add-on.
In the meantime, there's another interesting dataset I can show before we get to the HDI data.
Guess the city
This is the average monthly precipitation in European capitals. I selected an outlier that gets twice the amount of precipitation as the second most rainy capital in winter. I asked the audience to guess which city this is.
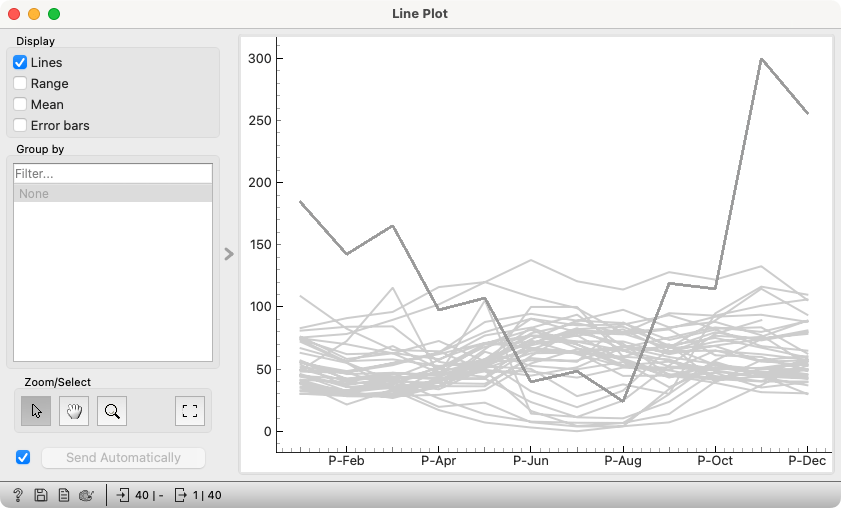
I didn't — but could — expect that they would suggest London. This was trivial to check. In the existing workflow (Data Sets that loads the data "Temperature and precipitation in European capitals," feeds it to Select Columns where I selected the precipitation data, and then to Line Plot), I added a Table to select London and fed it as a subset to the Line Plot widget.
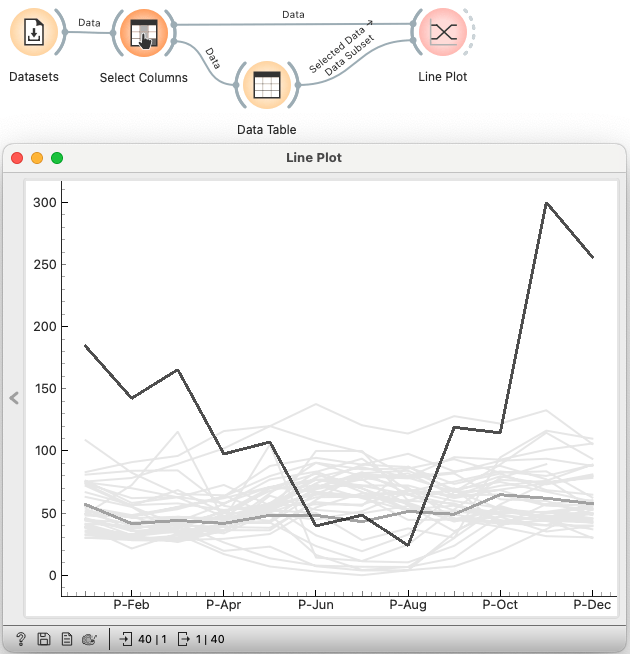
London is among the drier capitals in Europe.
So they said it could be some Scandinavian city. This time, I used a map: I selected the Scandinavian countries and the Baltics for good measure. And I deselected the outlier, to make sure it wasn't one of the lines in the subset.
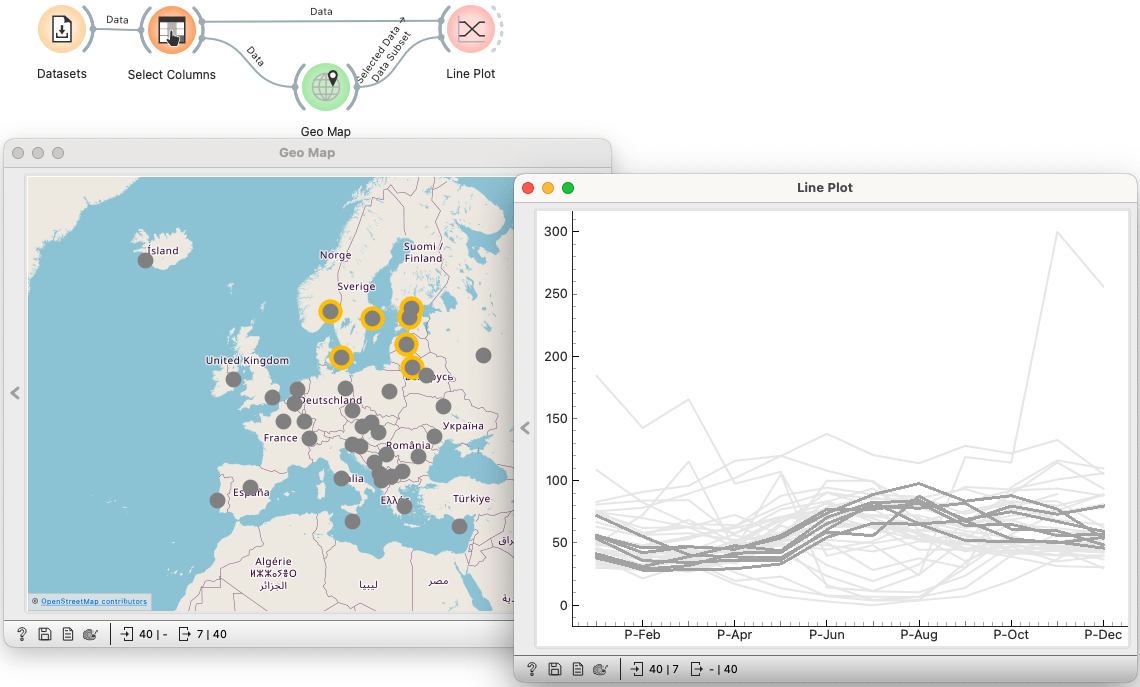
I added a spoiler: let us see both, temperature and precipitation.
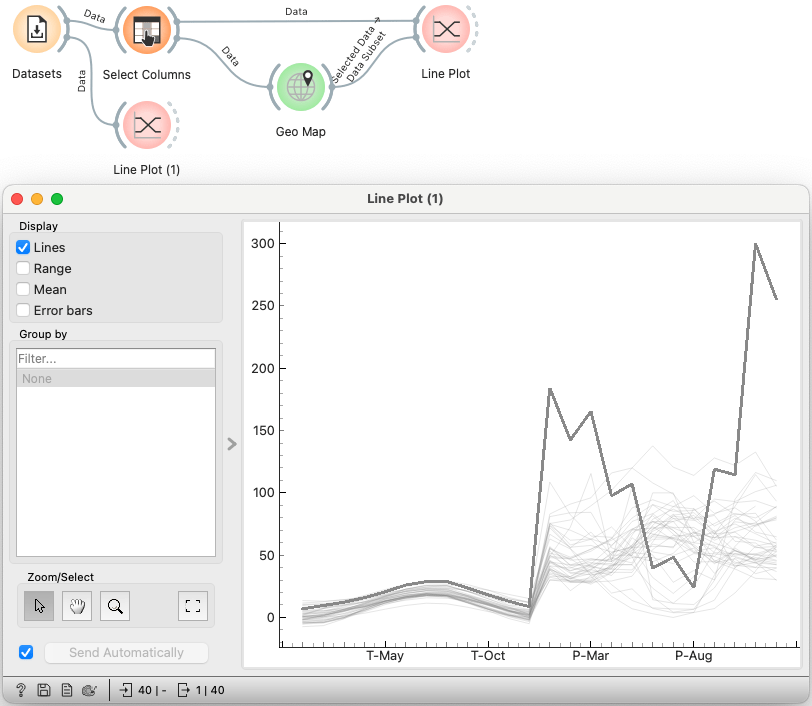
The left part shows the temperature, and both parts use the same scale, which is wrong. But it's clear that the outlier is one of the hottest capitals. And, mind you, it has very little precipitation in summer. So our guesses moved to the Balkans.
At some point, we guessed it — and confirmed it in Orange by connecting a Data Table to the Line Plot. The Table shows the data for the selected city: it's Podgorica, Montenegro.
How the Podgorica phenomenon was discovered (and explained)
Here's a story that happened when I compiled this data — and which I shared with the audience.
Ajda P. Žagar, a colleague from the Pumice project, collected part of this data. The idea was to create a school lesson about clustering related to geography. It worked but lacked the data on precipitation, which is an important factor in defining a climate. I thus added the data on precipitation — partly automatically, but for some capitals (including Podgorica), I manually copied the numbers from a website.
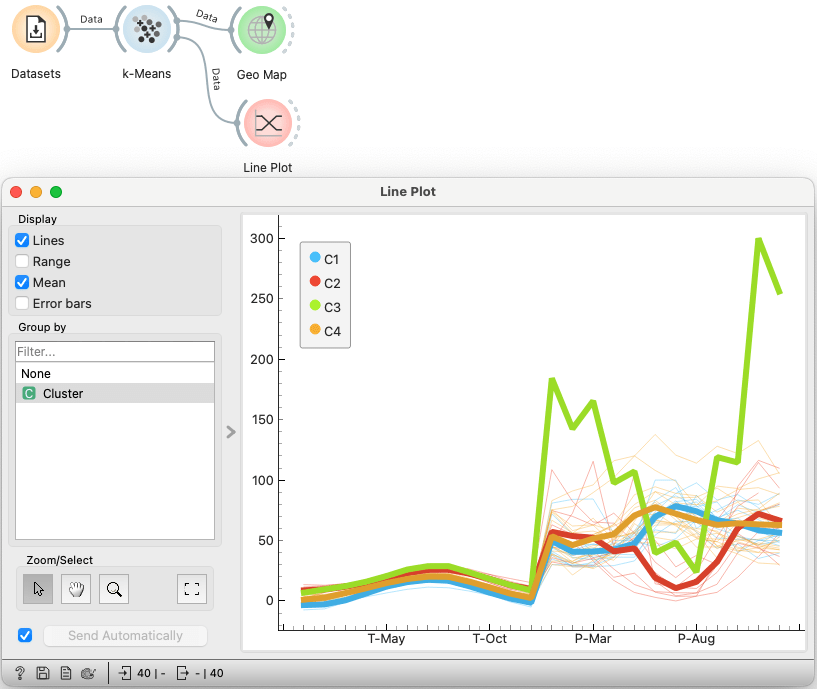
This gives reasonable clustering — but in order to get the expected three clusters, I had to request four. This is what happens.
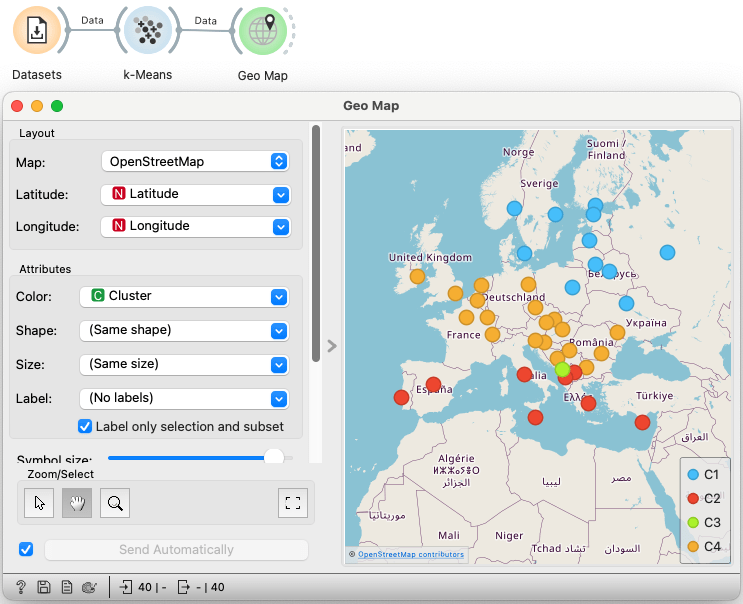
Seeing this clustering, I naturally wanted to check which city was in the green cluster — and what might be wrong with its data. I checked the data in the table and in the line plot.
A monthly average twice as high as the others must be a mistake, I thought. I found which city it was. I checked the numbers on the website — they were correct. I checked another site. And then another. The numbers differed slightly, but not by much.
So — it's true? Let's see what Wikipedia has to say about it.
The mean annual rainfall is 1,659 mm (65.3 in), making Podgorica by
far the wettest capital in Europe, Ljubljana being second with 1,362 mm
(53.6 in).
(By this time, I already knew that Ljubljana, my hometown, was the second.)
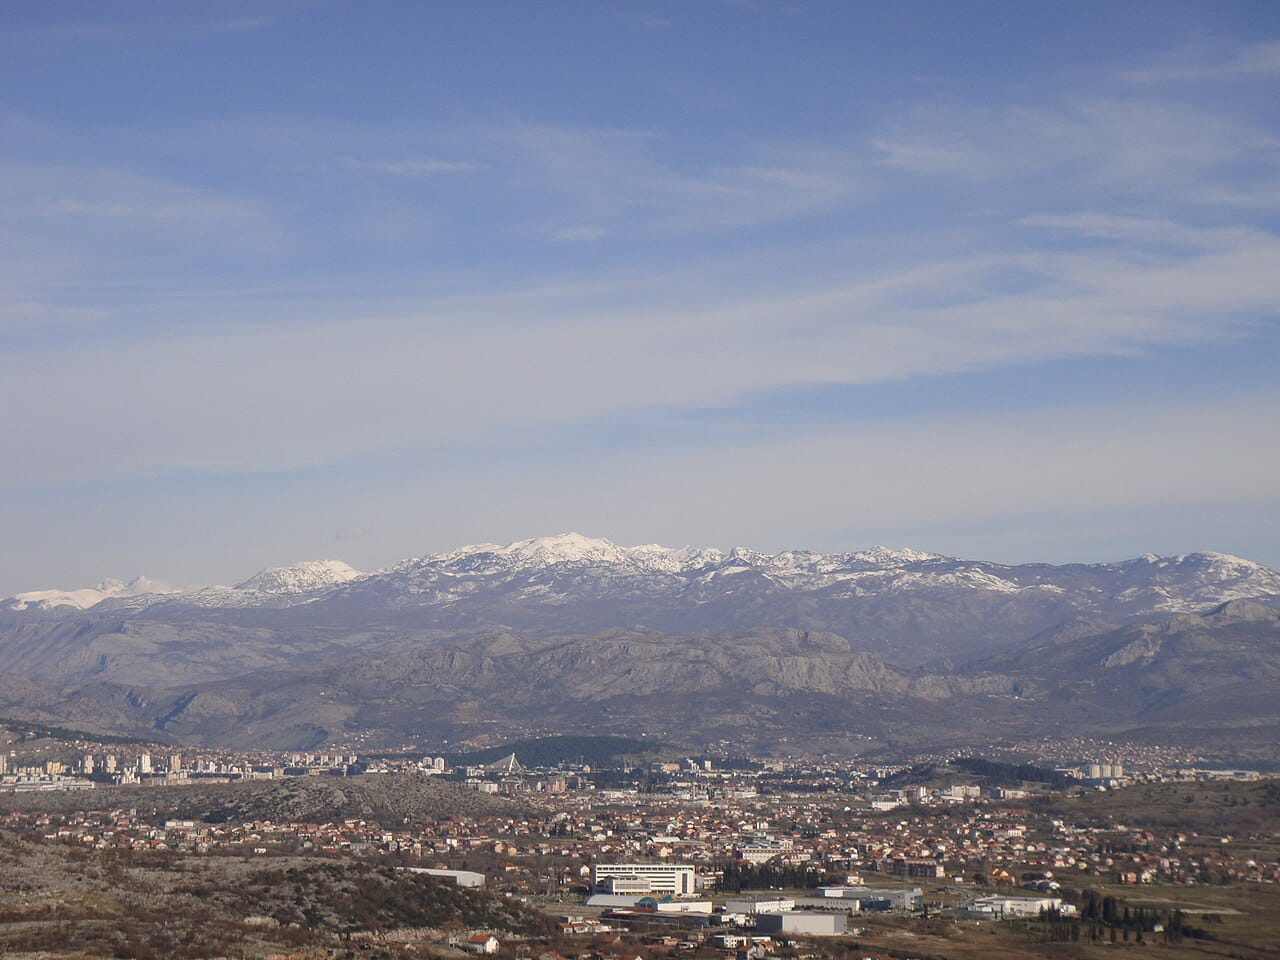
At the workshop, we didn't open Wikipedia. The moment we discovered it was Podgorica, a geography teacher in the audience said, "Oh, this is the orographic barrier."
The thing is: Podgorica is close enough to the Adriatic Sea, but it’s surrounded by hills. The humid air from the sea is pushed upward, and it rains. The situation in Ljubljana is similar, but there, the hills are all around the city, and Ljubljana is farther from the sea.
Climate change: A teaser
Teachers, naturally, had some questions. They always do. And Orange had answers (with a bit of help from me). We explored different climates — as discovered by clustering — and drew some more maps...
We also plotted another dataset, which looked much graver: the average monthly temperatures in Ljubljana over the last 100 years, broken down by decades. But let this be a story for another time — this one is already long, and there are some other thoughts I want to share.
Data tells stories; statistics shuts your mouth
Between the chance encounter with the person I might have misunderstood and misjudged, and the workshop, there was another meeting, which was related to teaching programming, algorithms, networks, and data literacy — with me covering the latter topic.
I thought about how teaching the other listed topics has a few decades of tradition and experience, while data mining and data literacy are relatively fresh topics, and we are still learning how to teach them. The only related existing tradition is in statistics. We must resist the temptation to teach data mining the same way as statisticians teach statistics. In short, we mustn't be boring.
Let me not start with explaining all the false beliefs held by the cult of null-hypothesis testers: read the Cohen's Earth is round (p < .05) or Gigerenzer's We need statistical thinking, not statistical rituals. With so much ink and bits spent on it, my adding to it would be futile. The p-value ritual is already banned from the most prominent journals in psychology; psychologists were mainly responsible for starting the cult, so let us hope they will be equally successful in extinguishing it.
As with any religious movement, you have those who started it with the best of intentions and the zealots who enforce it. In this case, Neyman and Pearson on one side, and Fisher on the other knew what they were doing, while zealots merged the two incompatible approaches into the NHST hodgepodge. They recite it in schools as if it were verses from the Koran, pester their students and colleagues who object to the Teaching, and — in the role of reviewers — uproot the heresy by rejecting papers that don’t adhere to the orthodoxy.
Would a true statistician be able to do any of the things I did in the workshop? Yes! A true statistician would. Fisher, Neyman, and Pearson would love to get their hands on the data we have today. Tukey would absolutely love it. And they surely would mind the ritual. In fact, they would (and did) hate it.
There's nothing wrong with statistics, except that it's been hijacked.
The blood group data is insufficient for drawing any conclusions, it doesn't yield to hypothesis testing, so: useless. For the precipitation data, well, the ritual would probably allow you to, huh, take data for some years, form the groups and then concoct a way to measure the significance of groups' stability in other decades or another useless feature. How boring is that?
Behaviourism strangled psychology for decades by prohibiting the areas of research that were not amenable to its prescribed methodology. Statistics — in the form taught by ritual adherents and required by many journals — does the same across entire science.
And — remember the forbidden word "outlier"? The whole discussion started around Podgorica. Its data was different. It is a clear outlier. But an outlier can be the most interesting thing in the data. (And at the same time, the one that zealots can't do anything with, so they just hate them.) So, what is it? An error? Something interesting, but outside the scope of our study? We essentially opted for the latter: I wanted three clusters, but created four to give Podgorica its own. I could have achieved the same effect by removing the outlier and creating three clusters. (Which is exactly what the morning zealot — whom I may have misunderstood — dreaded: you should not remove outliers, she said!)
And — remember the amazement at "You want to teach clustering in schools?" Clustering doesn't fit the sacred ritual so well, because the ritual requires setting the hypotheses before seeing the data, while clustering is exploratory. Why would you teach something that doesn't lead to the Truth?
But clustering is the best way to do something meaningful with the data. It’s far, far more exciting than any measure of central tendency that the zealots would teach instead.
On the other hand, you can teach about means, medians, and modes. And the most exciting thing children will see is a box plot (where you'd require them to remember which element shows what, so you can put it on the test).
The workshop that wasn't
The workshop was supposed to be a hands-on session on mining the Human Development Index (HDI) data. Luckily, I hadn't promised that explicitly — the topic wasn’t clearly set.
The workshop was scheduled from 13:15 to 14:30. At 14:20, we had finished with the precipitation data, so we had ten minutes left for the planned content. Instead, I spent that time on a conclusion: data tells stories. If you have data, software, and the skills to use them, your school lessons will never be boring. Data begs questions; questions lead to answers, which lead to more questions. You can explore, discover, and learn.
I don’t know how the teachers felt, but I thought they liked it. For me, it was great.