data, add-on, widgets, economy
Socio-economic data at your fingertips
Ajda Pretnar Žagar
Aug 31, 2022
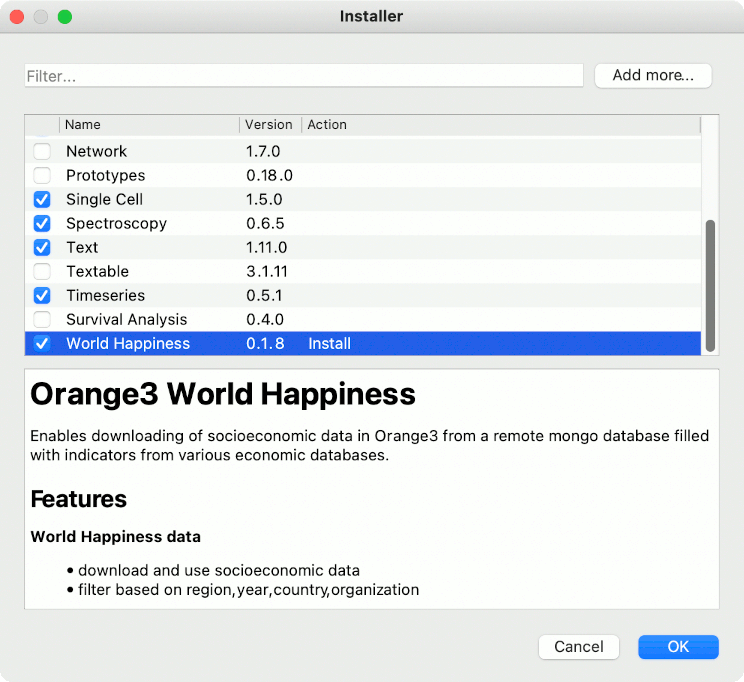
A new add-on has joined the Orange family! It is called World Happiness and it is intended for retrieving socio-econimic data from global databases. Go to Options --> Add-ons and select World Happiness from the list to install it.
Currently, it contains a single wigdet - Socioeconomic Indices. But fret not! This one widget can do many things.
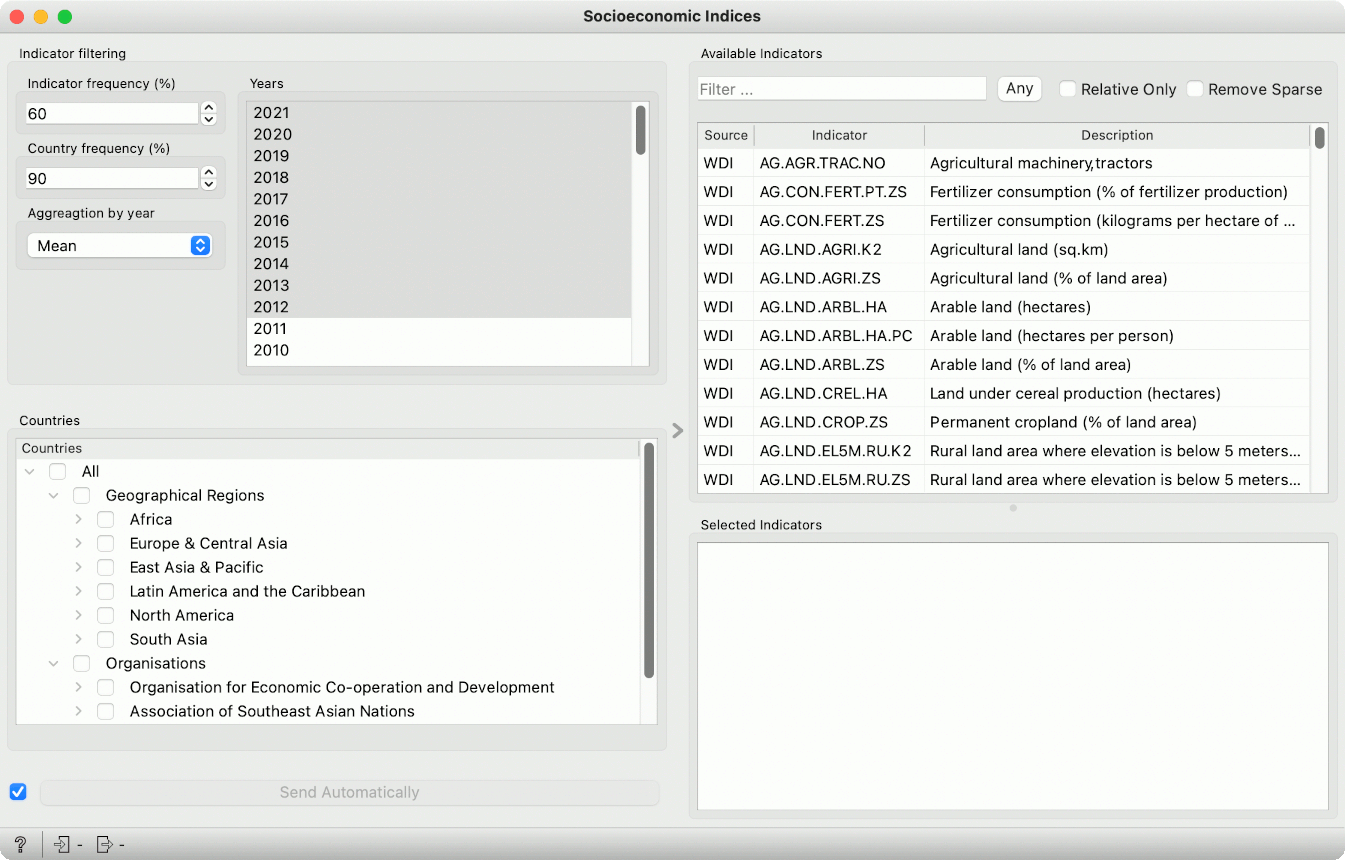
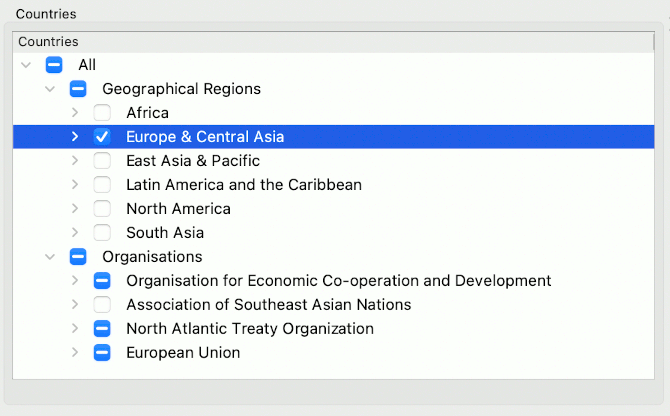
Say I wish to retrieve data for Europe and Central Asia, which I can select from the Countries list. I can go even further and filter by a specific country, but for now, let us go with the general region.
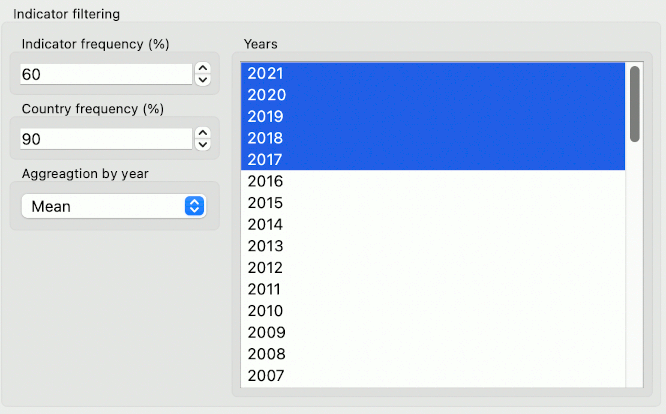
Next, I can set which period I wish to retrieve the data for. Say the past five years, from 2017 to 2021. On the left side, you will see some parameters. They define how many missing values we permit in the data. The first is the percentage of missing values for the indicator, say forest area in square kilometers. If more than 60% of the indicator values are missing, the indicator will not appear on the output. Similarly for the country - if more than 90% of the values are missing, the country will not appear on the output. Finally, the values will be aggregated by mean, meaning each year for each country will display an average indicator value.
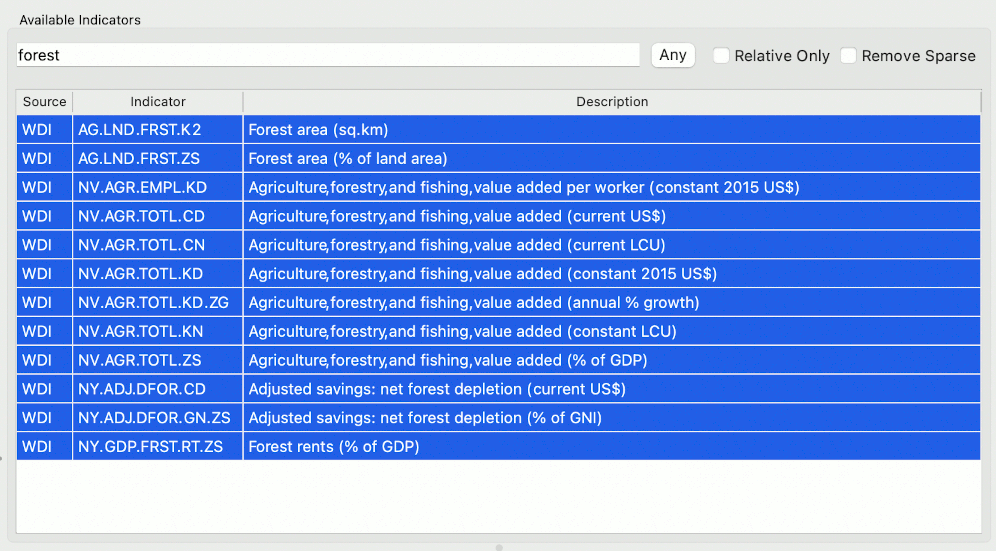
Finally, I will select the indicator I wish on the output. Say I am interested in forestry. I type "forest" in the filter. Only the indicators containing the word "forest" will be displayed below. Now, I select the desired indicator to send to the output. I will select all of them.
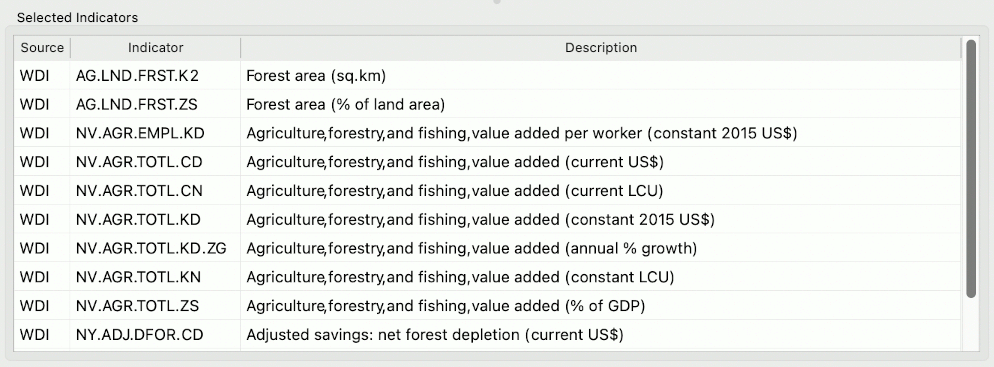
To actually send the indicators to the output, I have to move them to the selected indicators section, which is the final box in the lower right corner. If the retrieval was successful, you will see a number in the status bar at the bottom of the widget. I have retrieved 47 rows of data.
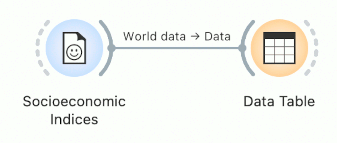
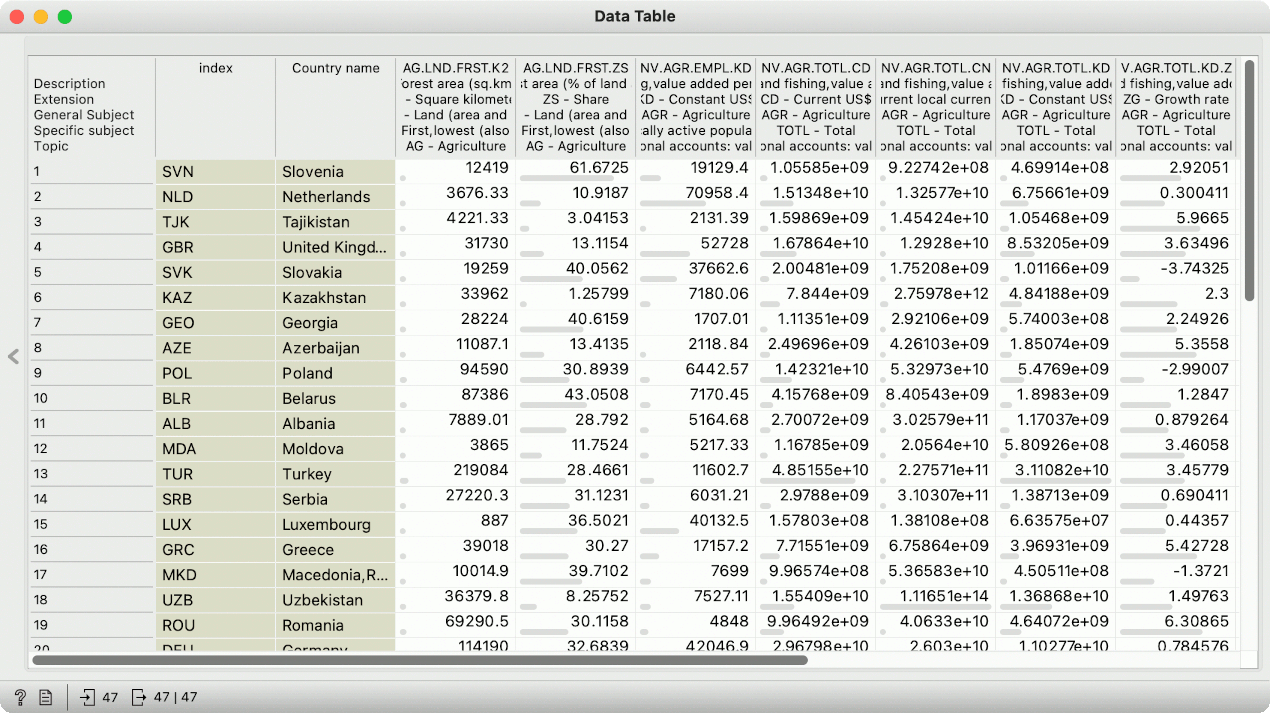
I can observe the data in the Data Table. Each row represents a country and each column an indicator. Now I can sort the data in the Data Table, observe means and medians in Box Plot, cluster countries based on given indicators and so on.
Enjoy exploring the data and let us know if you discover something interesting!