domain, PCA, transformation, apply domain
Why You Should Use Apply Domain
Ajda Pretnar
Aug 13, 2021
It can happen you'd see a widget in Orange and think: "What on Earth does this even do?" We admit, finding informative widget names is not always easy and Apply Domain had a least 5 different names so far. While it might not be clear what the widget does from its name, the actual functionality is one of the nicer ones Orange has to offer.
Say you are transforming your data with PCA. There's training data and test data (say you expect to get new data at some later point, so we are simulating the split here). For this example, we'll be using Wine data from Datasets widget.
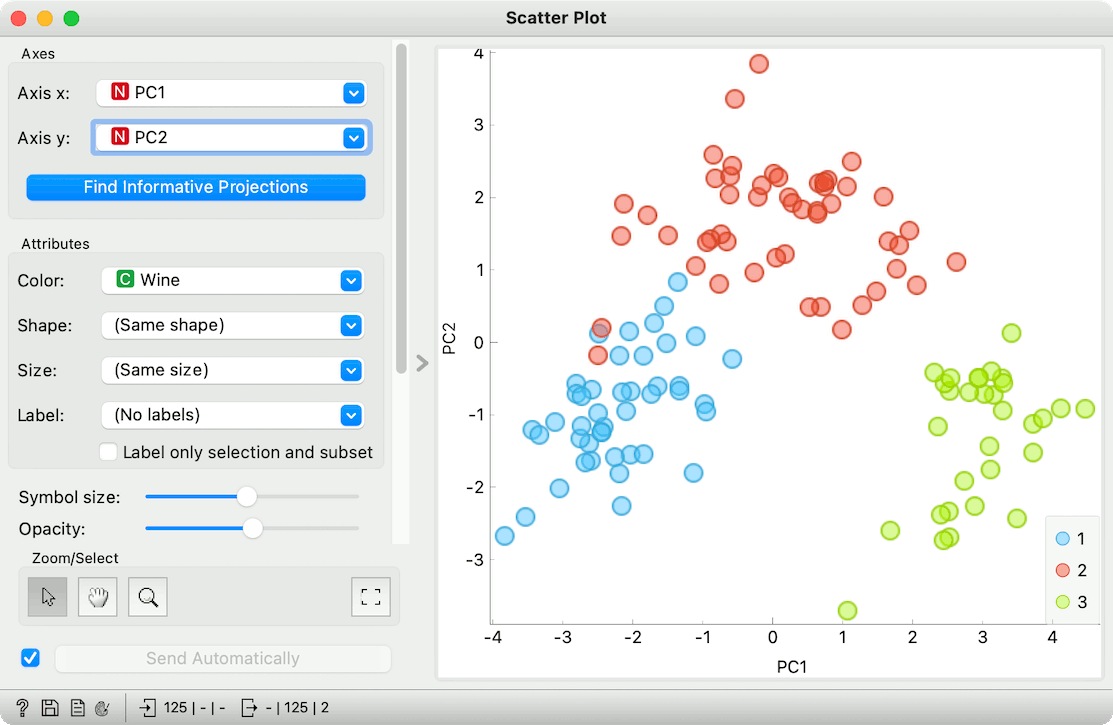
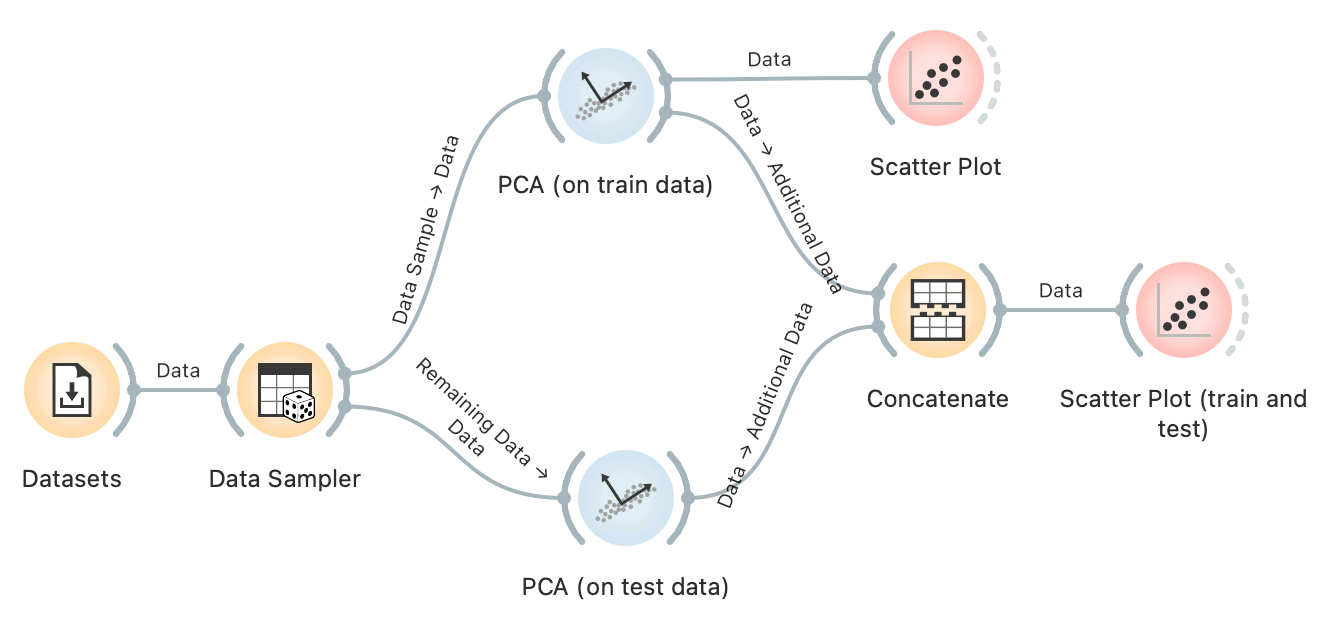
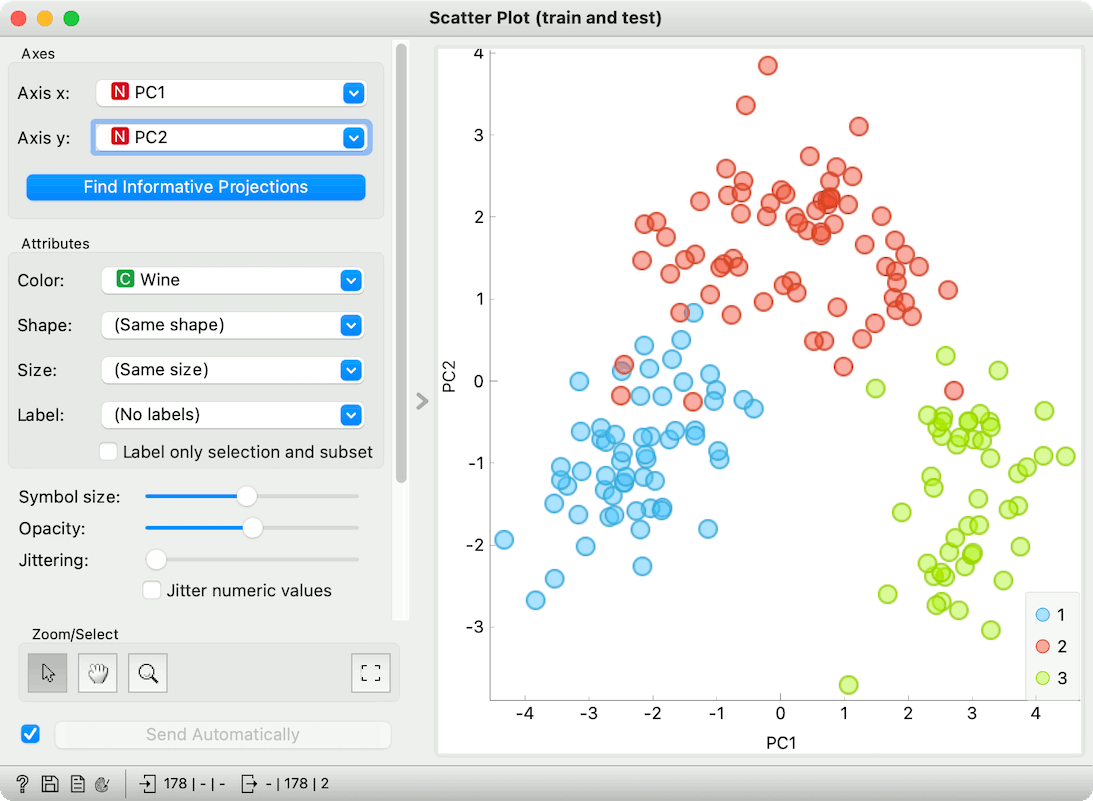
Transforming the data with PCA is straightforward. Apply the PCA, select a number of components that cover a solid amount of variance and output the transformed data. We can observe the 2-dimensional PCA plot in Scatter Plot.
Now, let us transform the test data with another PCA, using the same parameters. Use Concatenate to merge all the data points into a single table and plot the points in Scatter Plot. Make sure that Treat variables with the same name as the same variable is checked in Concatenate!
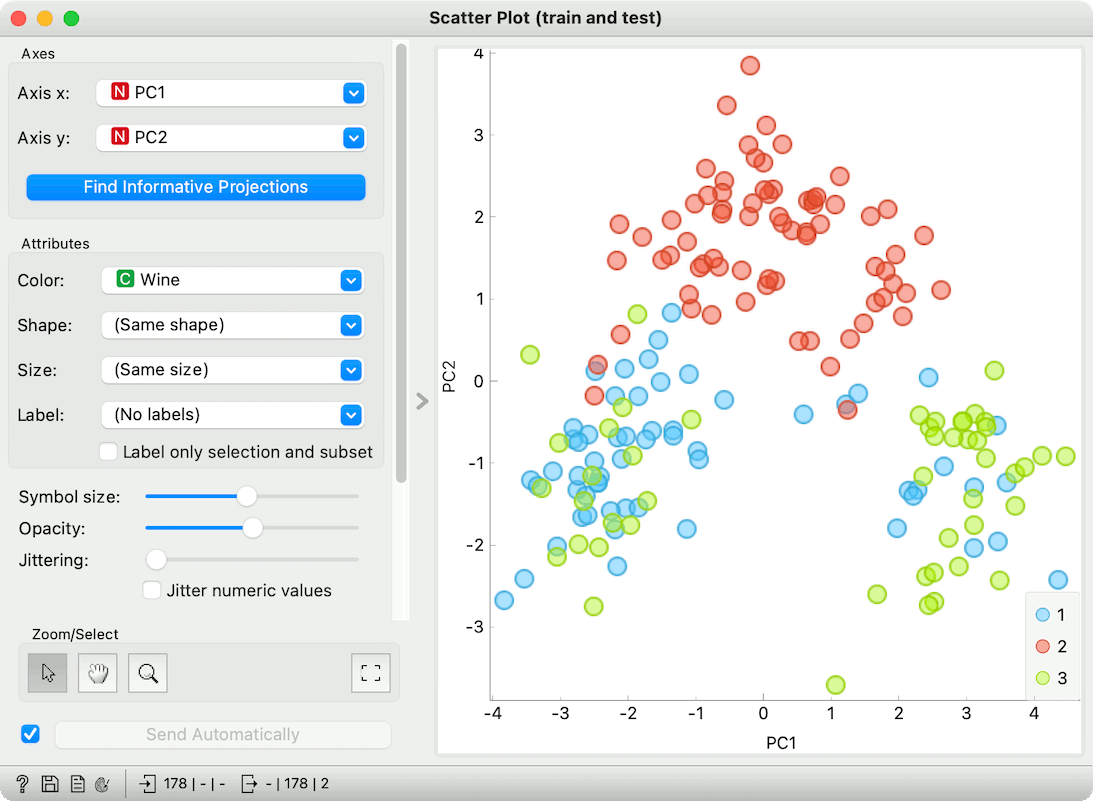
Scatter plot looks strange. The wine types are mixed up, especially in the lower part of the plot. This is because the test data and the train data were not transformed to the same PCA space.
Enter Apply Domain. The widget uses template data to transform new data to the same domain (essentially the same data space). Connect Transformed Data to Apply Domain as Template Data. And Remaining Data from Data Sampler as Data.
Apply Domain outputs transformed data, which can be once again merged with Concatenate (keep the same settings as before). Now, observe the results in a scatter plot.
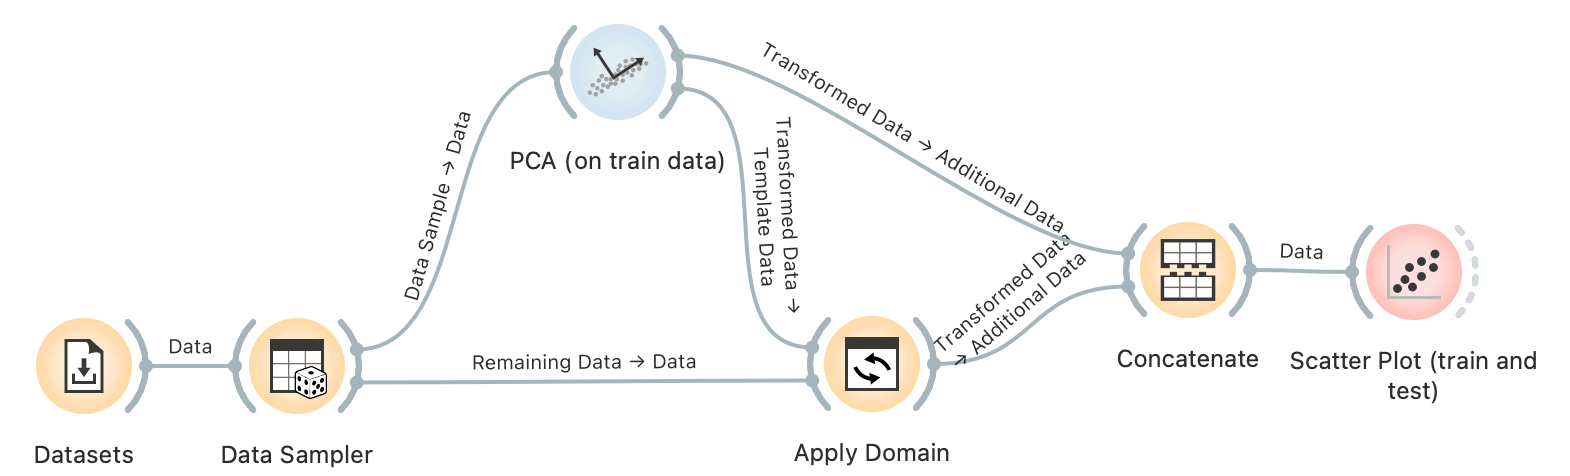
Well, look at that! The data is properly transformed and can be nicely discriminated by wine type in the PCA space!