embeddding, PCA, dimensionality reduction, workshop
PCA vs. MDS vs. t-SNE
Blaž Zupan
Jun 17, 2021
I recently enjoy studying and showing differences between t-SNE and other data embedding and projection techniques. In particular, in some recent hands-on courses, we often introduce data visualization by principal component analysis, multidimensional scaling, and t-SNE. We would start with the zoo data set, where the data set is smaller, and the difference are less pronounced. We then traverse through employee attrition data set with exciting clusters exposed in t-SNE. To finish, and especially for the academic audience, we then show and compare the three different dimensionality reduction techniques on data from single-cell gene expression data. There, t-SNE discovers clusters of same-type cells, while PCA and MDA fail to expose interesting data structures.
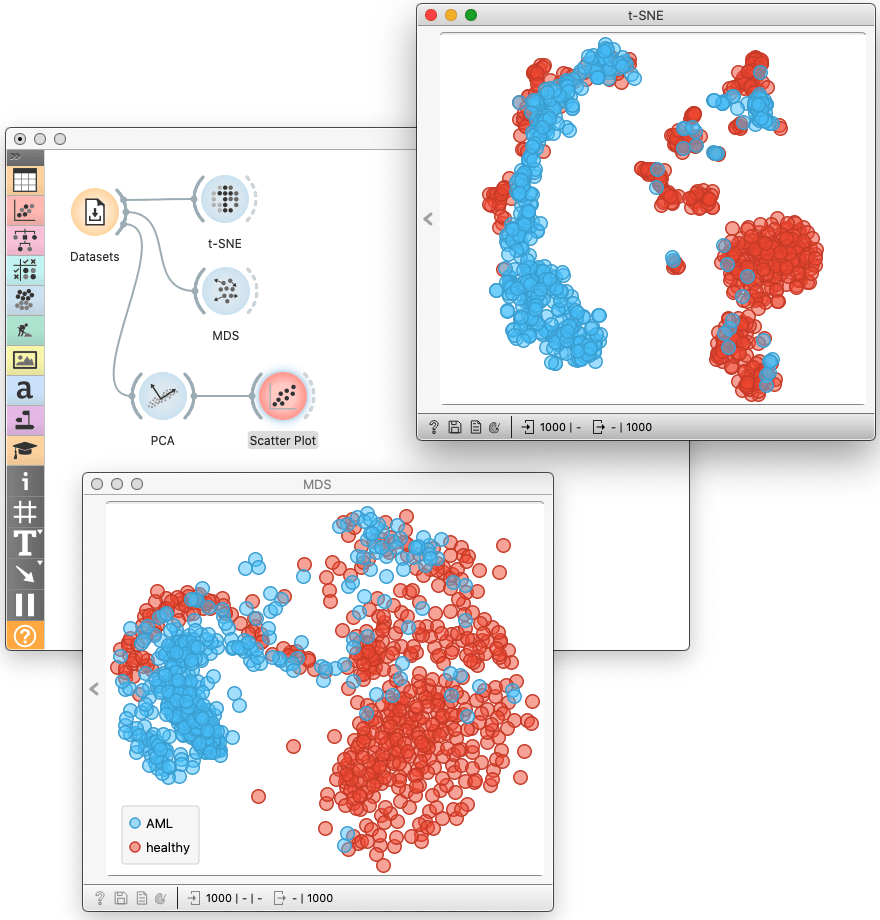
All the data sets I have mentioned above are available in Orange through the Dataset widget.
While all the three methods aim to reduce the dimensionality of the data, their goal is different. The principal component analysis seeks to preserve the variance in the data. When we use it to construct a two-dimensional projection, it finds the projection plane were the most spread data. Multidimensional scaling aims to preserve the distances between pairs of data points, focusing on pairs of distant points in the original space. Differently, t-SNE focuses on maintaining neighborhood data points. Data points that are close in the original data space will be tight in the t-SNE embeddings.
Interestingly, MDS and PCA visualizations bear many similarities, while t-SNE embeddings are pretty different. We use t-SNE to expose the clustering structure, MDS when global relations matter, and PCA as a preprocessing technique to reduce dimensionality and remove noise.