archaeology, workshop, image analytics, amphorae
Data Mining for Archaeologists, part I
Ajda Pretnar
Apr 23, 2021
Recently, we held a workshop for a group of archaeologists. While archaeologists are quite well-versed in quantitative analysis, data science was still quite new for most of the participants. Our aim was to introduce basic data science concepts through archaeological use cases. One such case that came to our mind was predicting a type of the artefact from the image.
Related: Data Mining for Anthropologists
We took three best-documented amphora types (types with the highest number of images) from the Archaeology Data Service portal. We also added some metadata describing each amphora subtype.
This is how our data looks like.
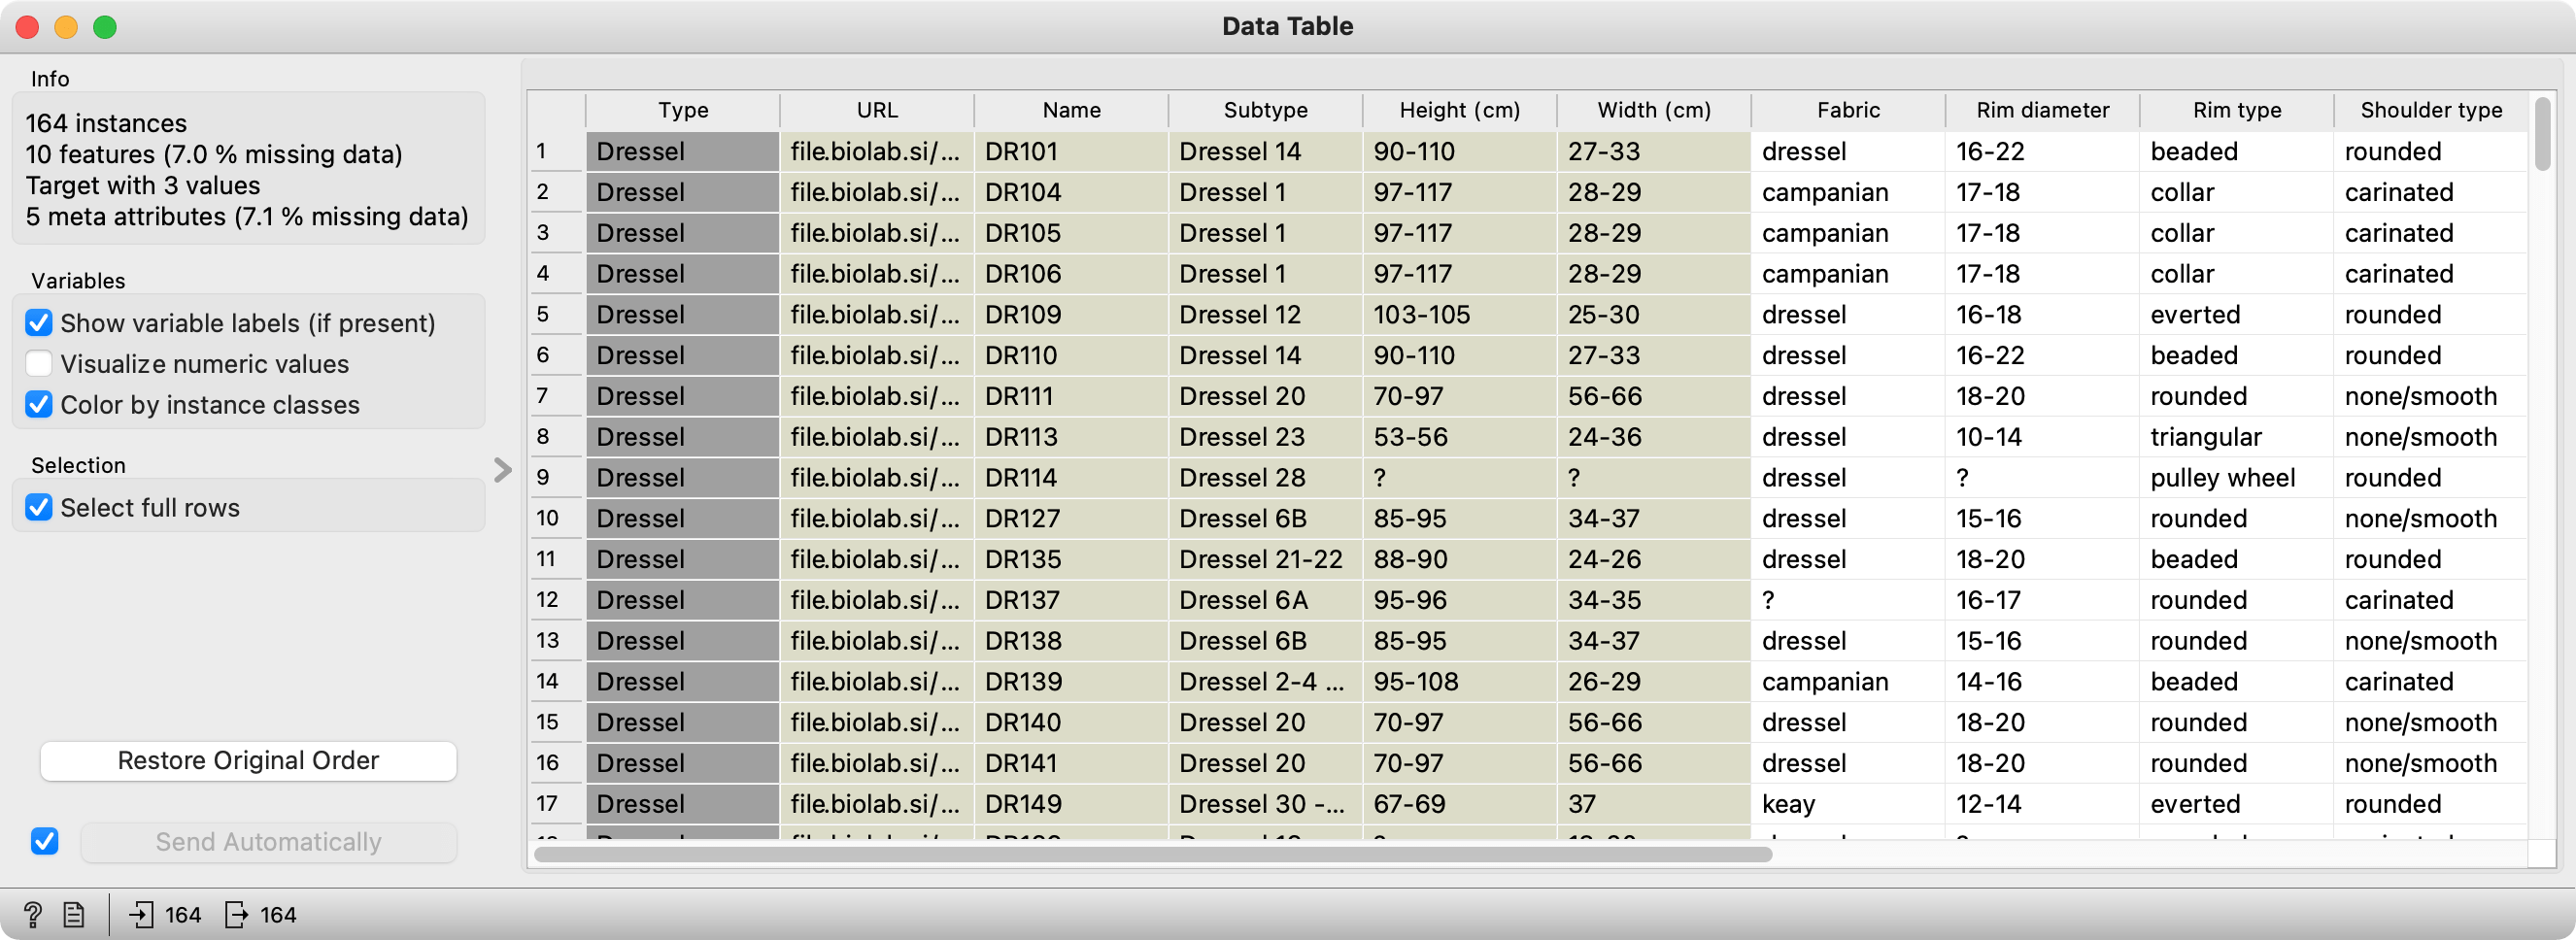
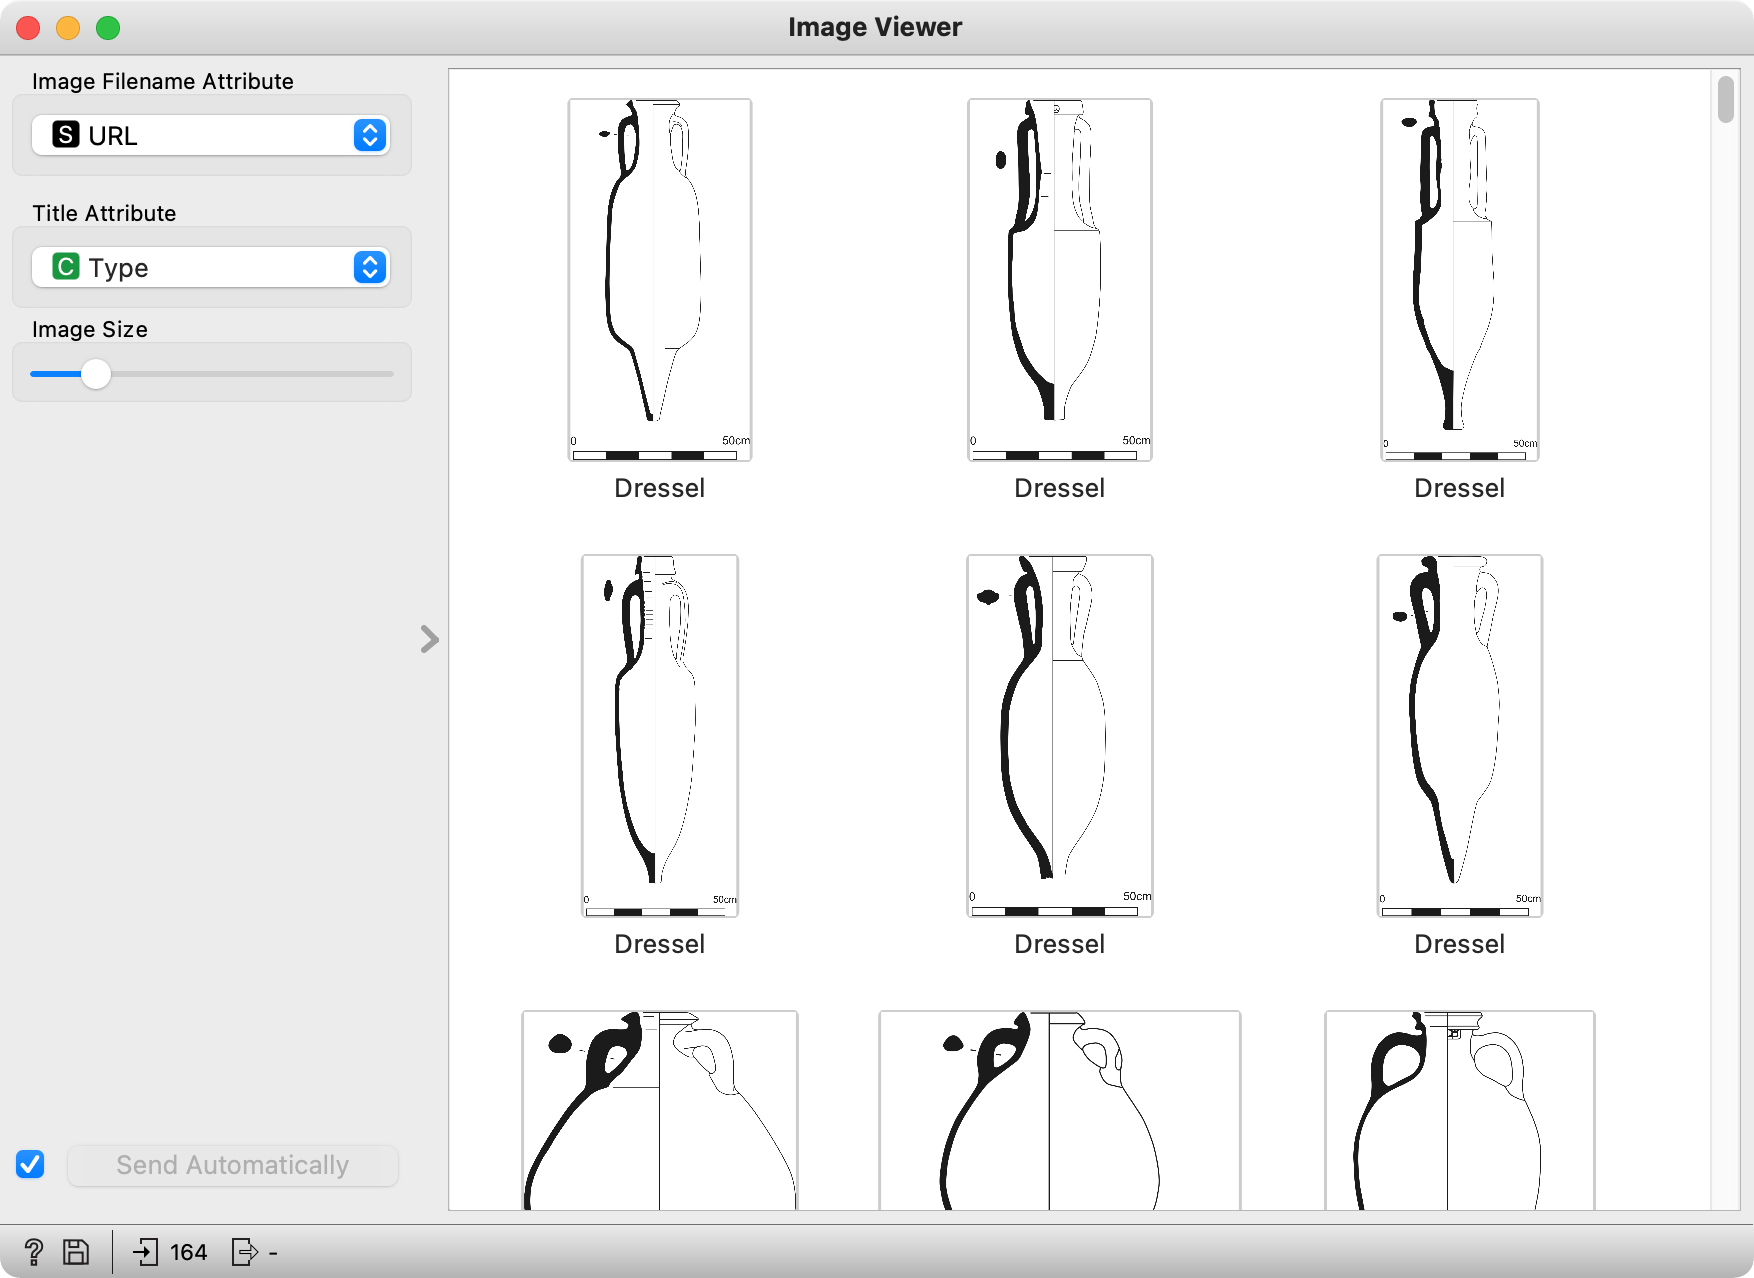
Each row represents one amphora, with type, image URL, subtype, and metadata included. Let us observe the data in an Image Viewer from the Image Analytics add-on.
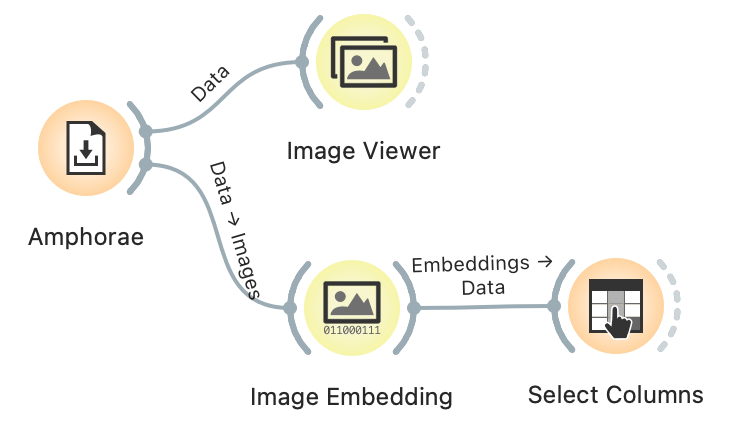
Images now have to be converted to numbers, so that predictive models will know how to infer patterns from them. The procedure of describing an image with a vector is called embedding and in Orange, it can be found in Image Embedding widget. We will use a simple, pre-trained Inception v3 model, but it is possible to train custom models specifically for archaeology.
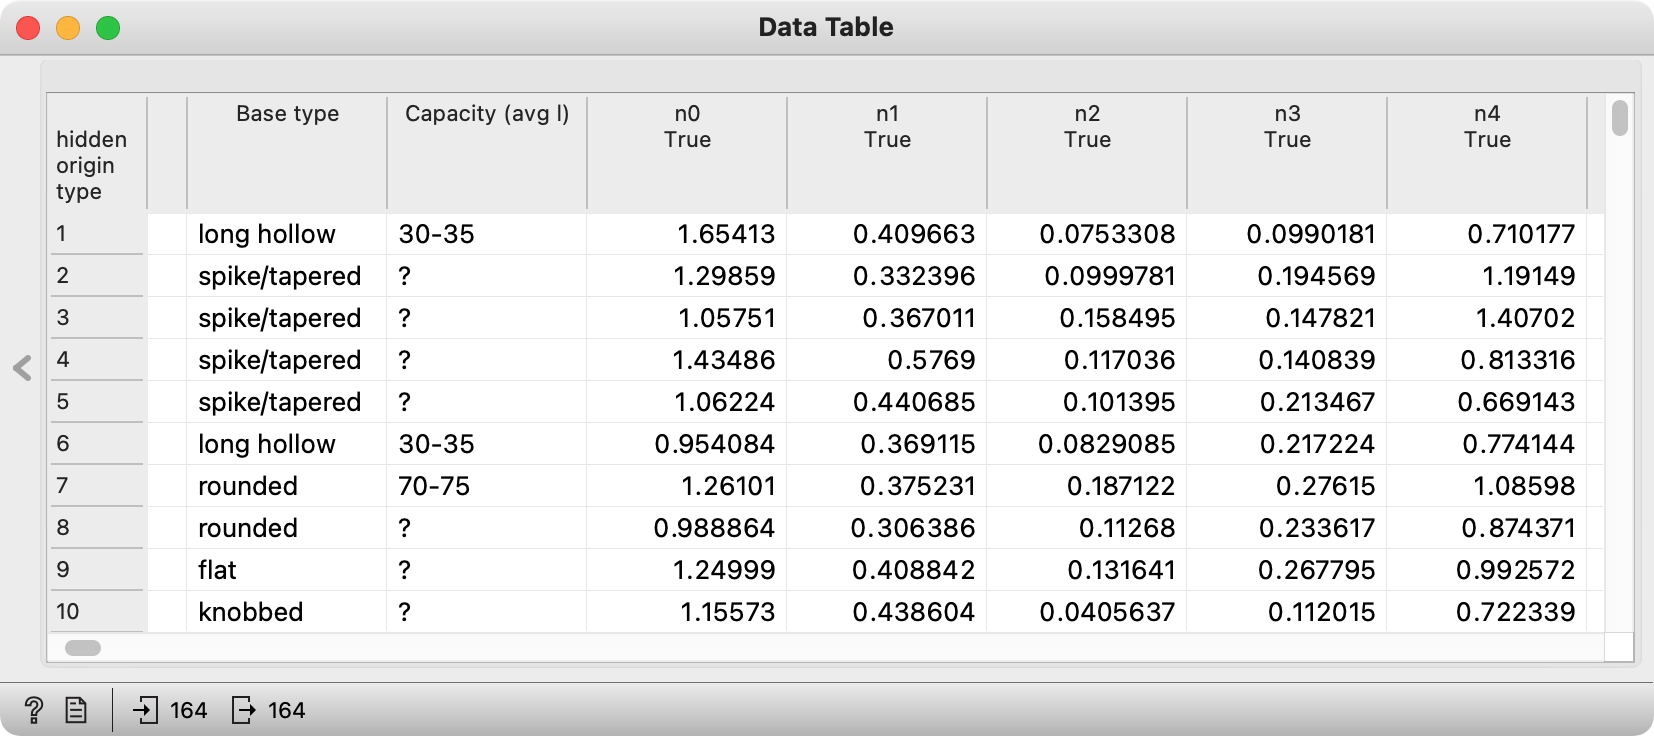
The result of embedding is a long line of numbers.
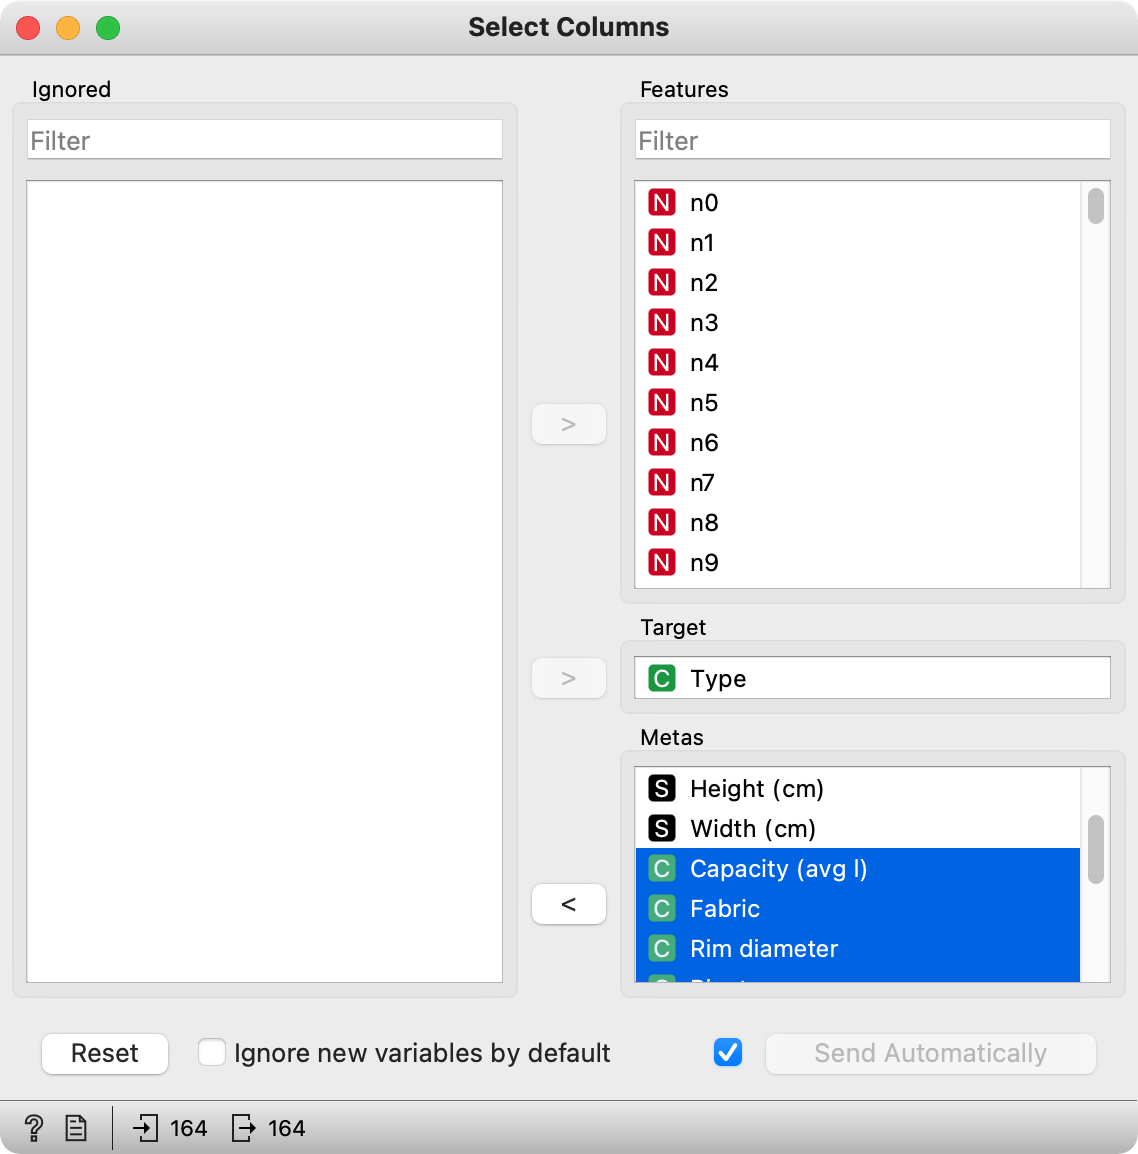
For the predictive model to consider only image vectors, we need to move metadata to ... well, meta attributes. We will do this with Select Columns.
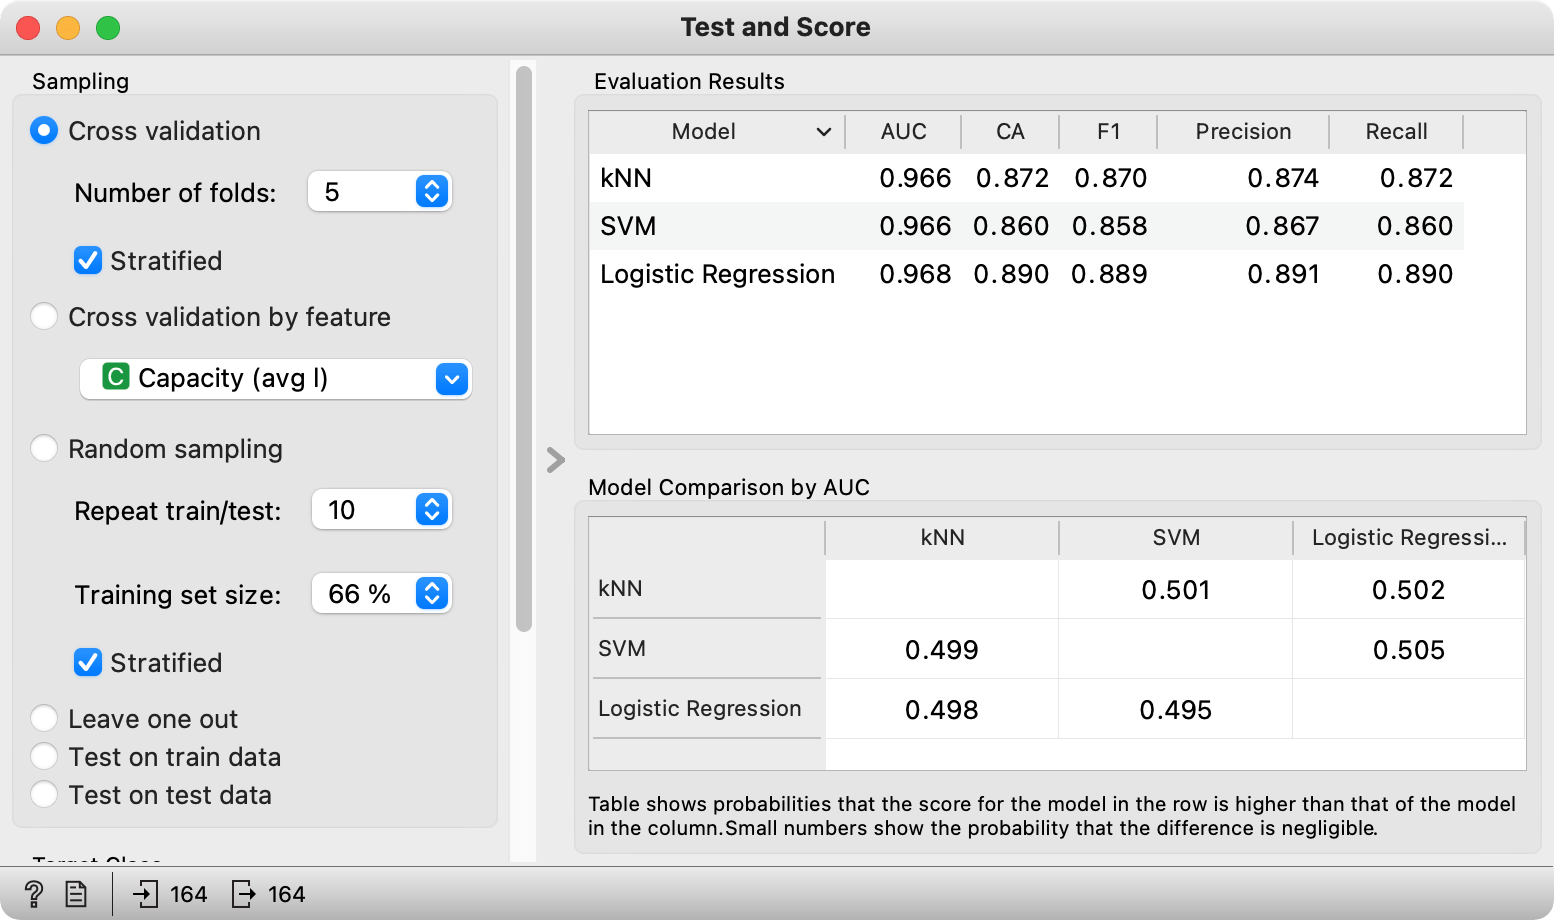
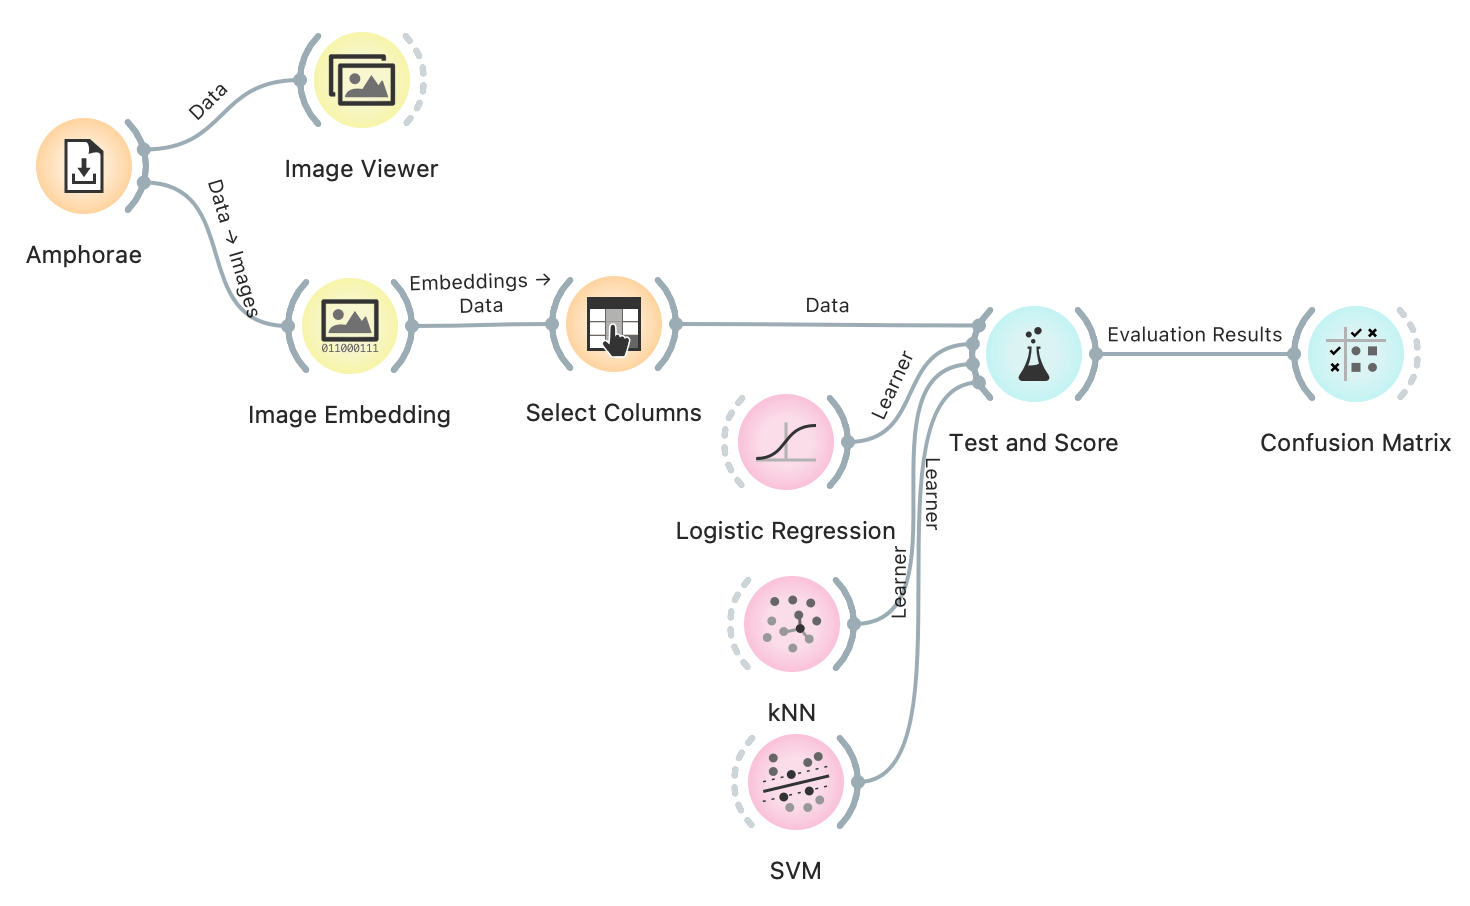
Now, we can build our prediction model. Or a couple of them. We will use Logistic Regression, kNN, and SVM, as these are quite successful for working with images. We connect the data and the learners to Test and Score. Seems like all of our models are quite accurate, with logistic regression having the highest AUC score.
Looking at the Confusion Matrix, logistic regression also best distinguishes between Dressels and Gauloises. It makes 13 mistakes, fairly equally confusing Dressels with Gauloises and vice versa. The other two classifiers more frequently confuse Gauloises for Dressels, so they are slightly biased in this sense.
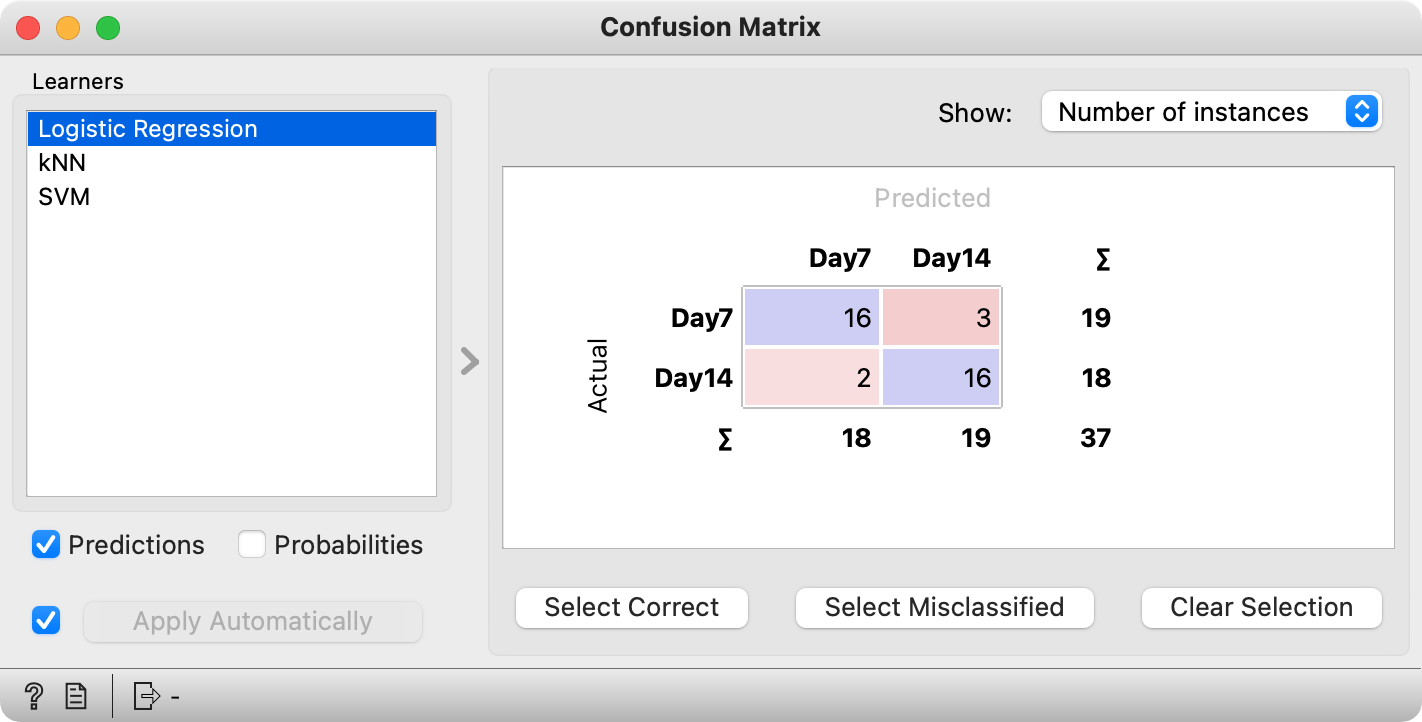
It always makes sense to check the distribution of misclassifications to determine the quality of the model. If the model just predicts the most frequent class, it is useless. Having more data would surely make this model distinguish between amphora type better.
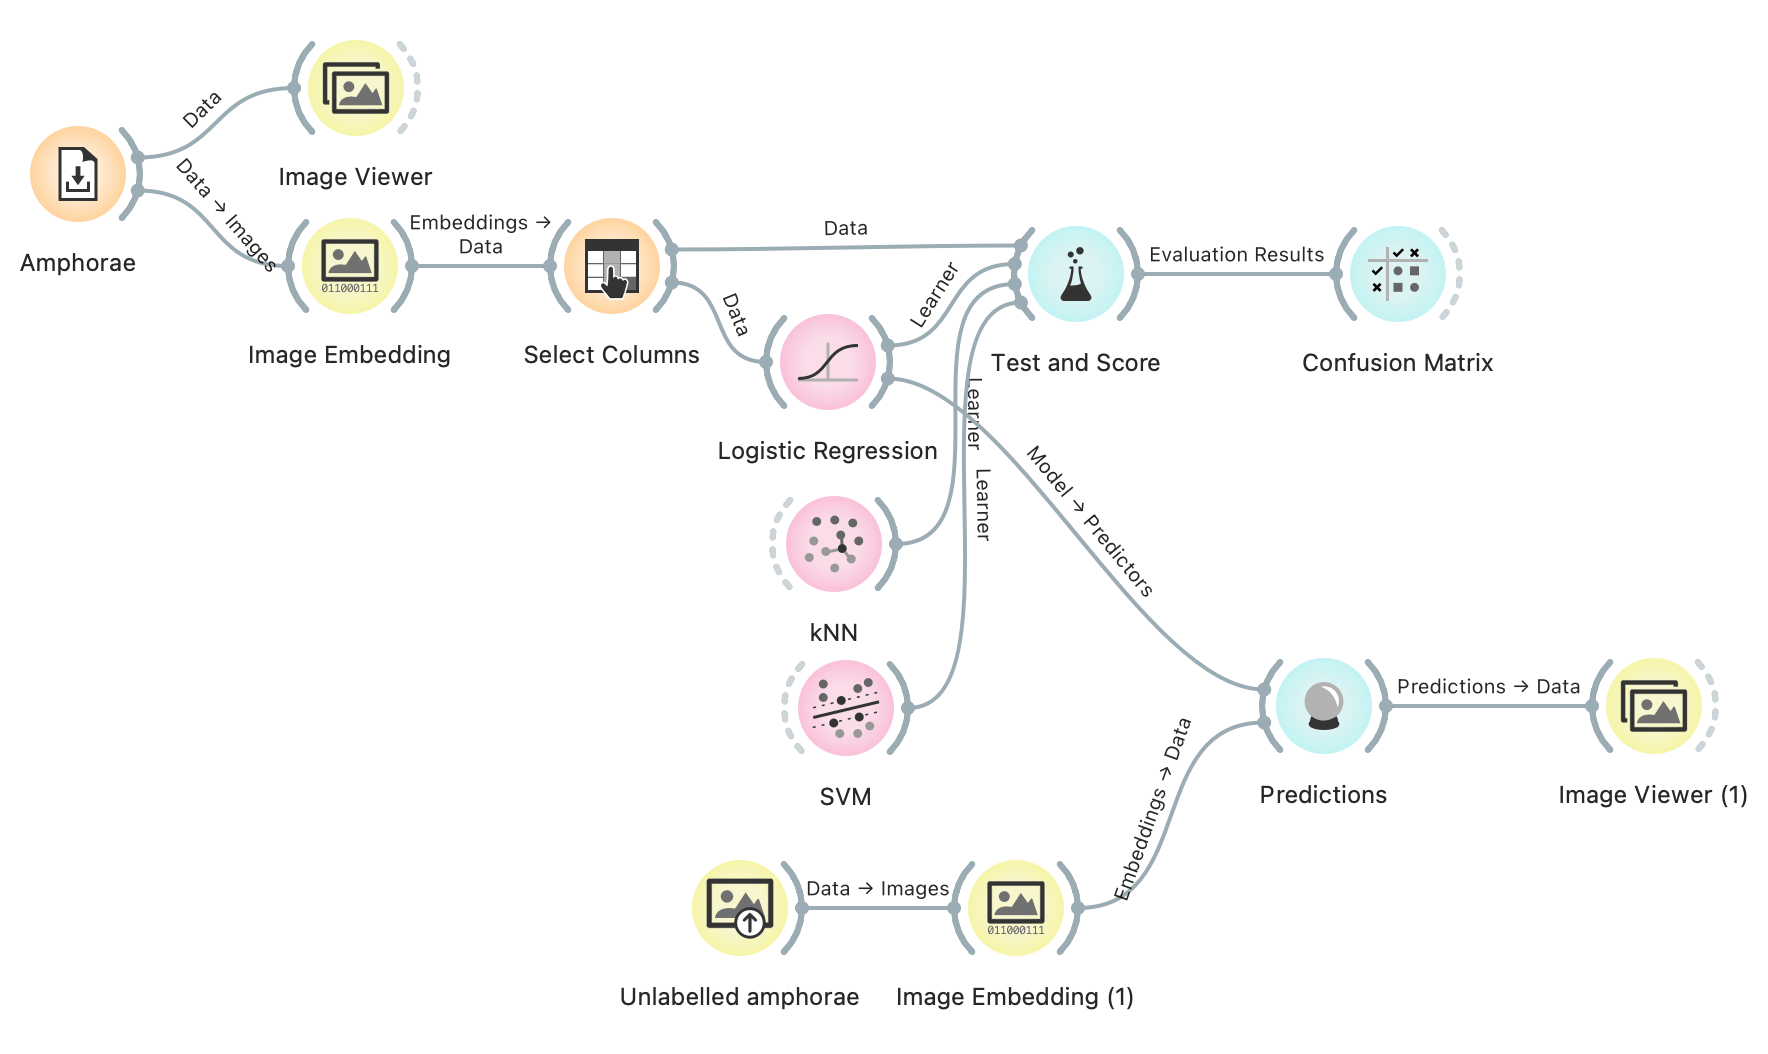
We can use the model for predicting the type of amphora for unlabelled images. Go to the internet and find some Dressels, Gauloises, and Keays. I have three images here. I put them in a single folder and I will load them with Import Images widget. We have to pass the data through another Image Embedding widget, because this data too needs numbers. Finally, we pass the data and one of the models (say, logistic regression) to Predictions. Don't forget, logistic regression needs the data input to word with Predictions (you need to pass the model, not the learner).
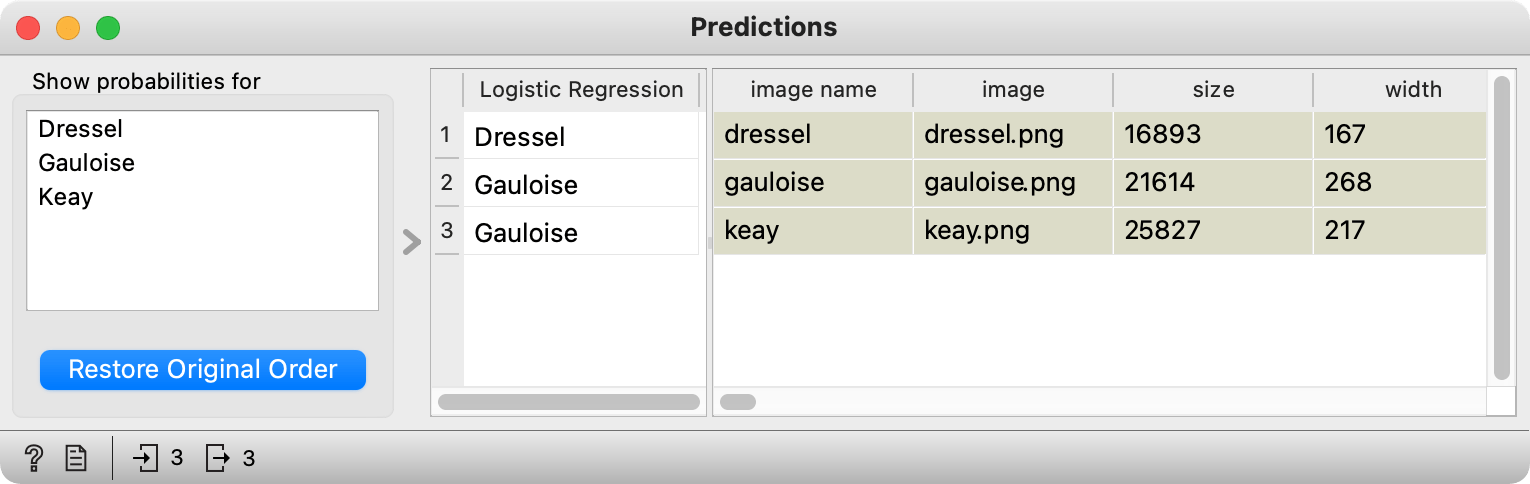
Seems like Dressel and Gauloise were successfully predicted, while Keay was mislabelled as a Gauloise. Not what we would have expected. Could archaeologists among you figure out, why this Keay amphora was mislabelled?
In the second part of Data Mining for Archaeologists, we will have a look at geo-tagged data and how to plot them on a map.