text mining, word distribution, bar plot, word cloud
Observing Word Distribution
Ajda Pretnar
Jan 27, 2021
In text mining, one of key tasks is understanding and inspecting the corpus. It makes it easier to determine the preprocessing techniques and downstream analysis (the selection of document frequency weights, topic modelling technique, lemmatization and so on).
Even though Orange sometimes doesn't have a widget for a specific task, the said task can be achieved with a combination of widgets and their outputs. Let us look at an example of word distribution. There is no such widget in Orange, but word distributions are generally available in Word Cloud. Word Cloud shows a list of most frequent words and their frequencies on the left and a cloud visualization on the right.
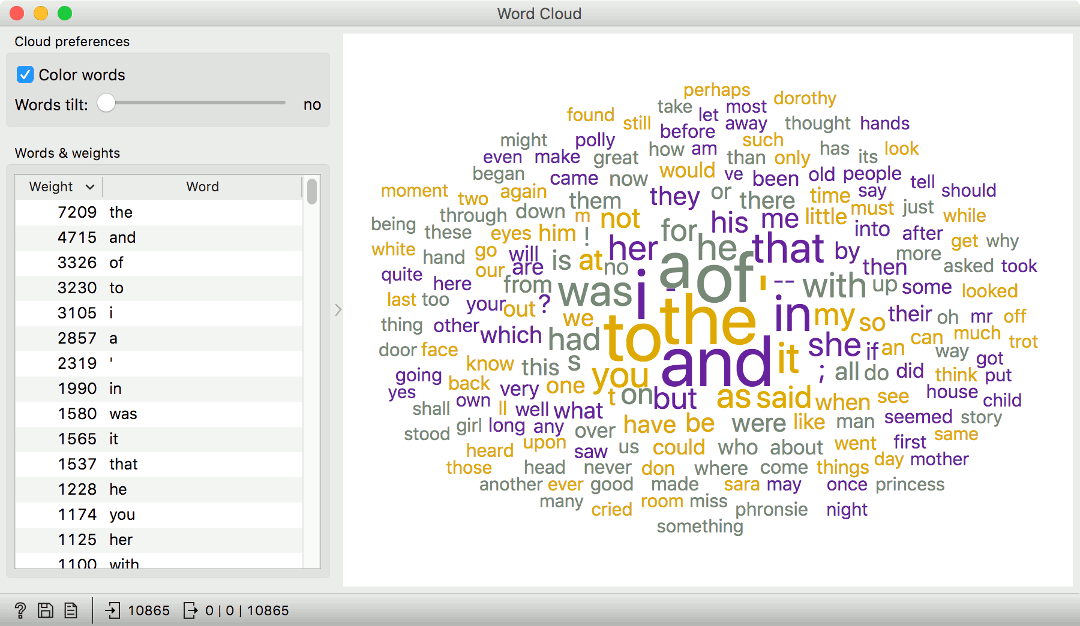
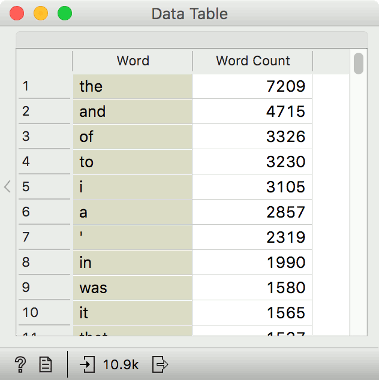
This is a great start, but Word Cloud only shows the 100 words and the visualization doesn't directly correspond to the word frequency (words are scaled so that very frequent words don't overwhelm less frequent ones). Yet Word Cloud has an output called Word Counts, which outputs a table with words and their frequencies in columns. Just what we would like to see!
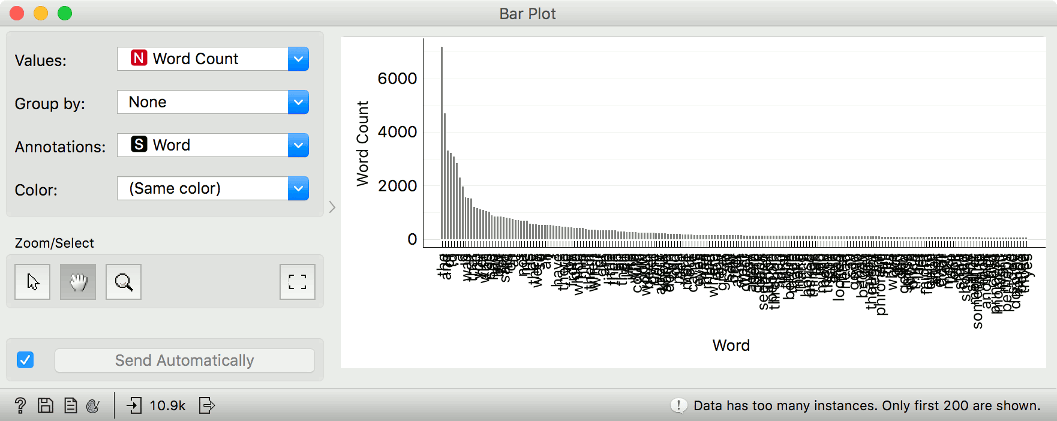
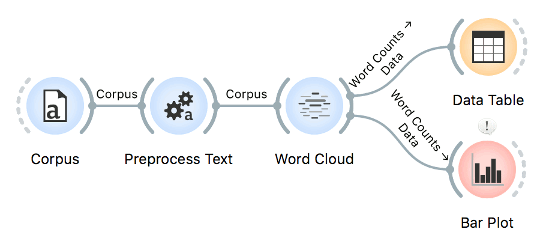
Can we see these frequencies as distributions? Yes, we can. A general widget showing numeric values (such as word counts) is Bar Plot. We pass the Word Counts output of Word Cloud to Bar Plot. We can also label each bar by setting Annotations to Word.
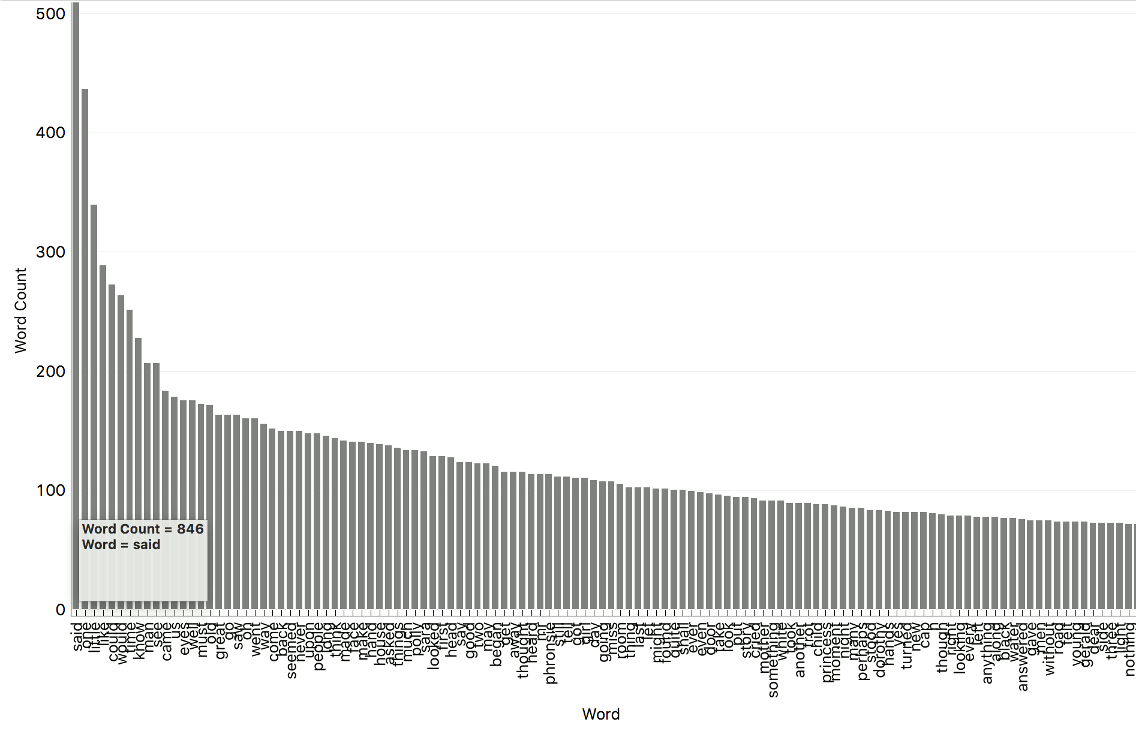
If we zoom in, we can see that "the", "and", "of", "to", "a" are by far the most frequent words. This calls for some preprocessing, particularly stopword removal. We place Preprocess Text between Corpus and Word Cloud and use default preprocessing. Our bar plot has changed. Now, the most frequent word is "said", so perhaps another round of stopword removal is necessary.
Orange widgets are intended to be as general as possible, which it easy to stack them into custom workflows. Don't forget to explore all the outputs different widgets offer, for example the All Topics output from Topic Modelling, Concordances from Concordance, or Grouped Data from Pivot Table.