classification, conference, education, interactive data visualization, workshop
Text Analysis Workshop at Digital Humanities 2017
AJDA
Aug 08, 2017
How do you explain text mining in 3 hours? Is it even possible? Can someone be ready to build predictive models and perform clustering in a single afternoon?
It seems so, especially when Orange is involved.
Yesterday, on August 7, we held a 3-hour workshop on text mining and text analysis for a large crowd of esteemed researchers at Digital Humanities 2017 in Montreal, Canada. Surely, after 3 hours everyone was exhausted, both the audience and the lecturers. But at the same time, everyone was also excited. The audience about the possibilities Orange offers for their future projects and the lecturers about the fantastic participants who even during the workshop were already experimenting with their own data.
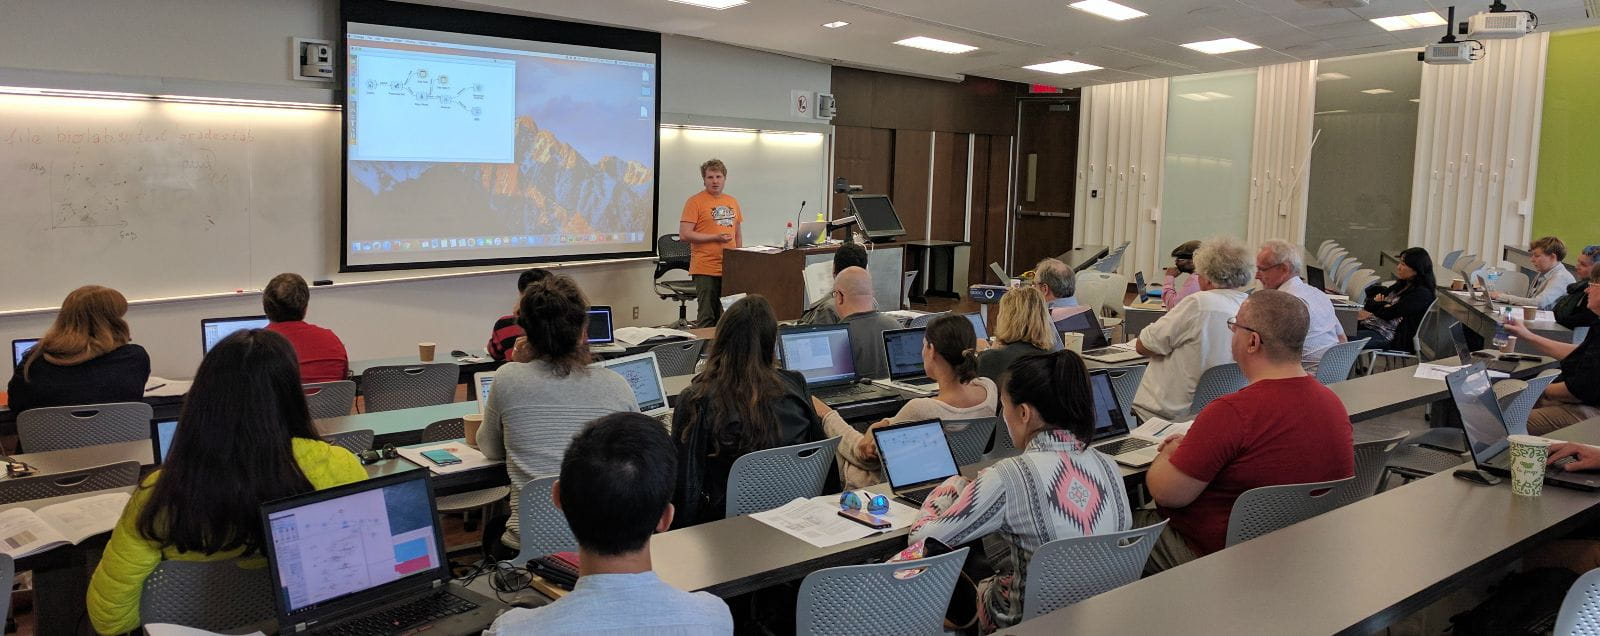
The biggest challenge was presenting the inner workings of algorithms to a predominantly non-computer science crowd. Luckily, we had Tree Viewer and Nomogram to help us explain Classification Tree and Logistic Regression! Everything is much easier with vizualizations.
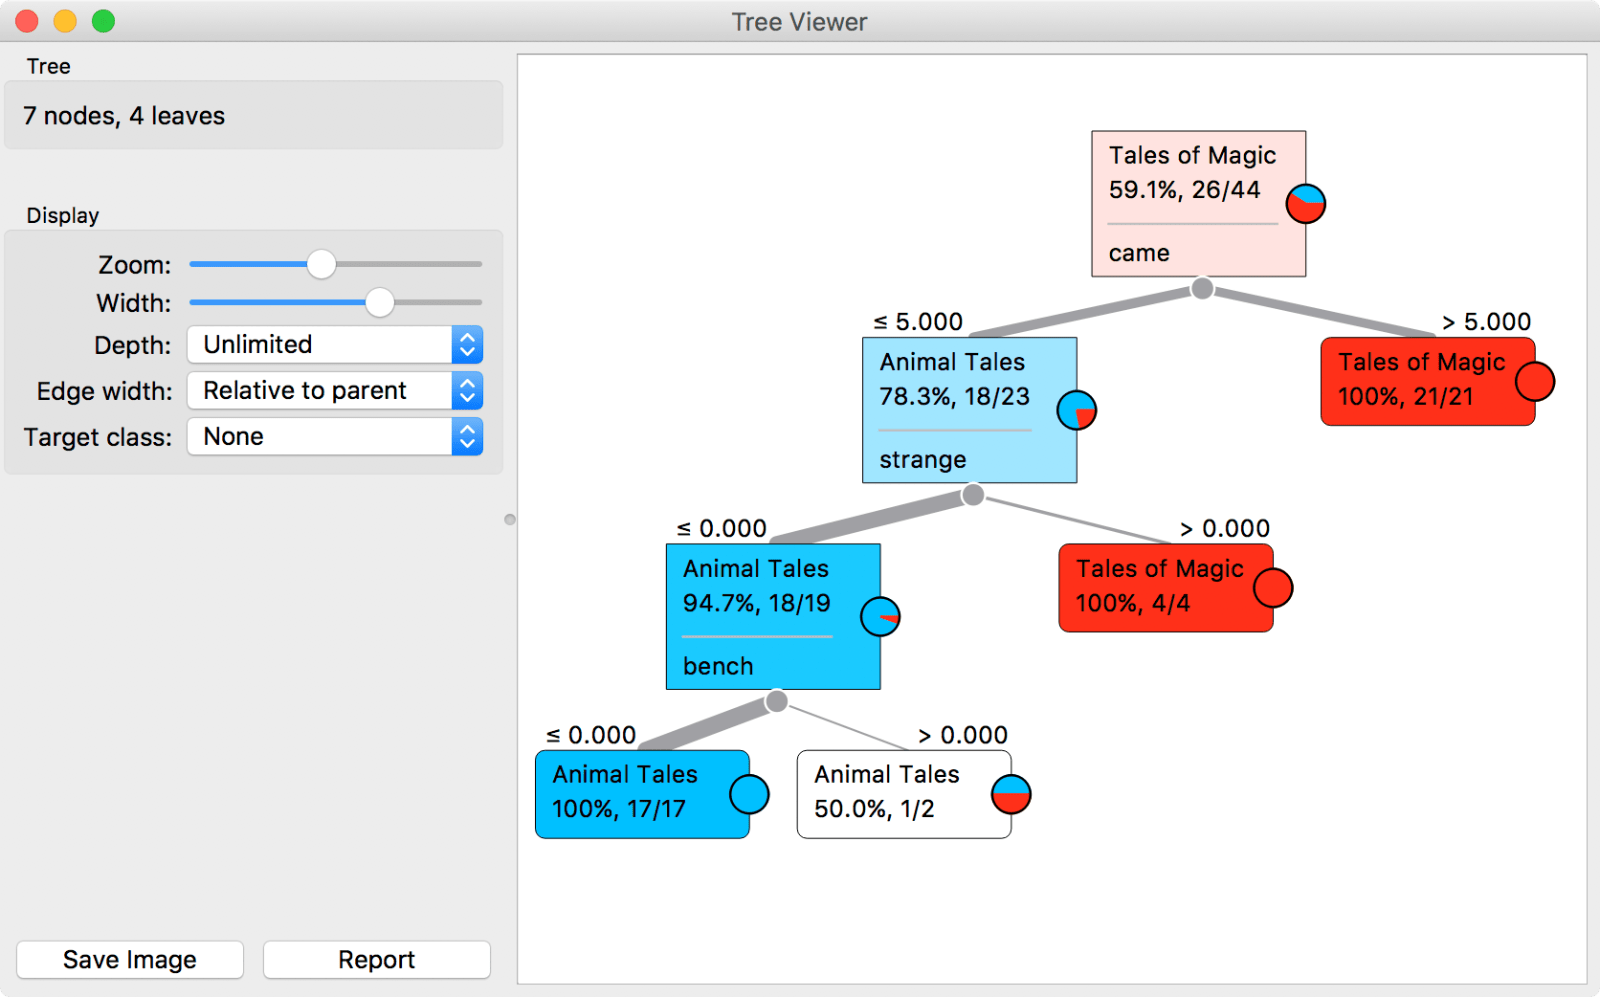
Classification Tree splits first by the word 'came', since it results in the purest split. Next it splits by 'strange'. Since we still don't have pure nodes, it continues to 'bench', which gives a satisfying result. Trees are easy to explain, but can quickly overfit the data.
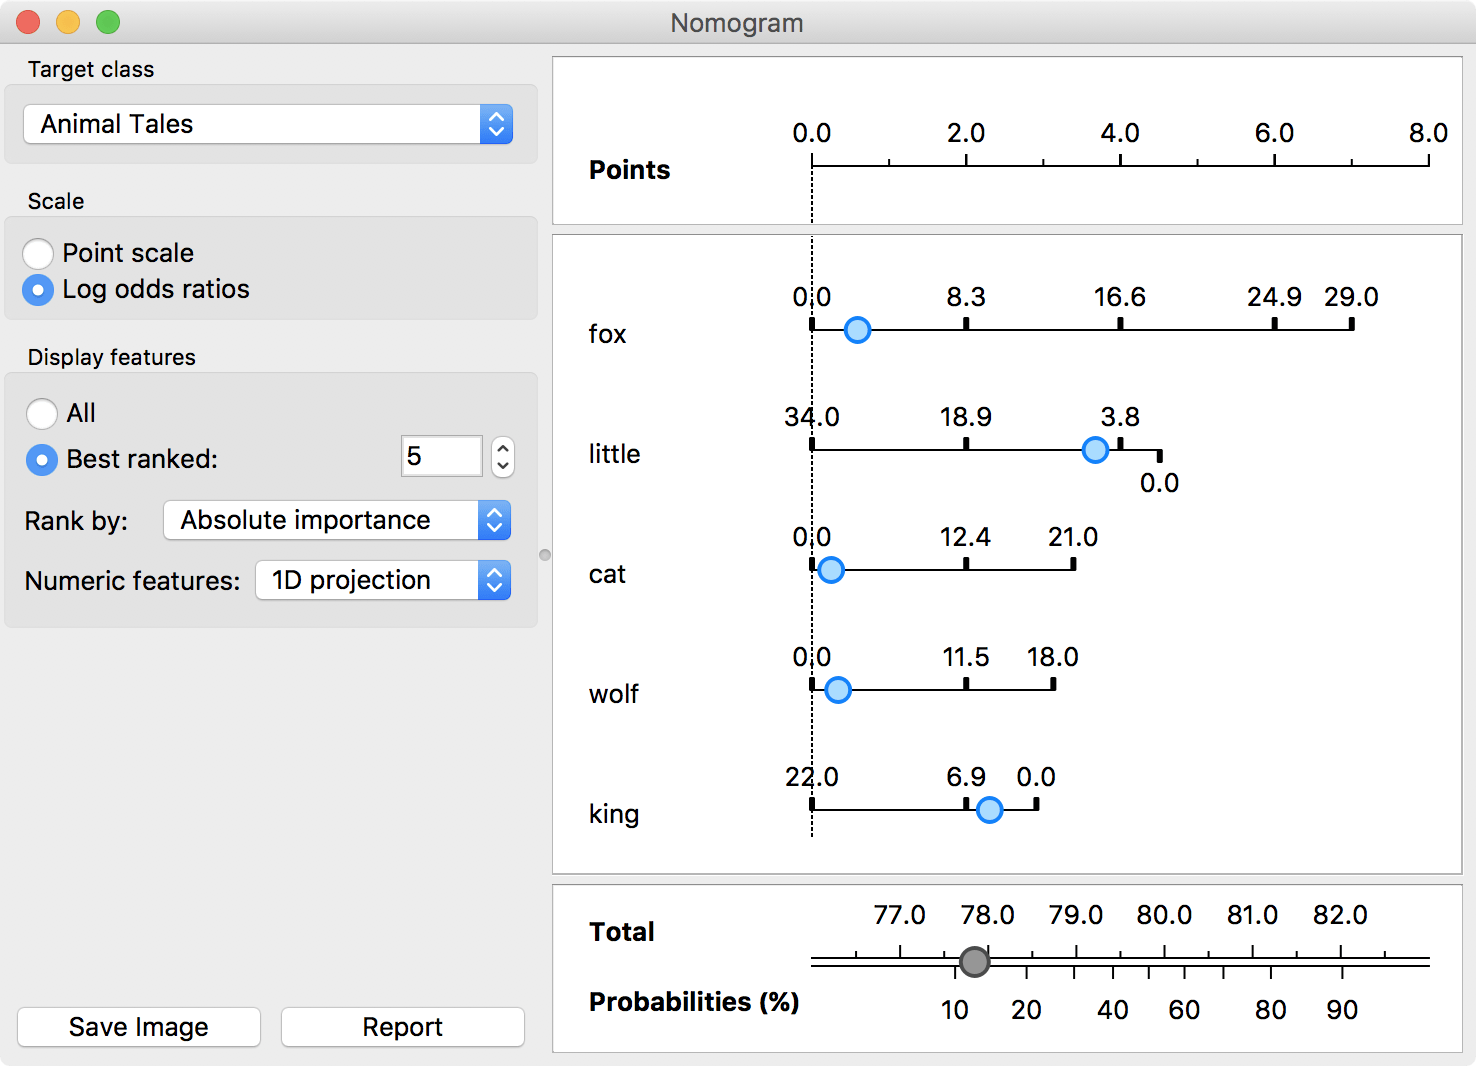
Logistic Regression transforms word counts to points. The sum of points directly corresponds to class probability. Here, if you see 29 foxes in a text, you get a high probability of Animal Tales. If you don't see any, then you get a high probability of the opposite class.
At the end, we were experimenting with explorative data analysis, where we had Hierarchical Clustering, Corpus Viewer, Image Viewer and Geo Map opened at the same time. This is how a researcher can interactively explore the dendrogram, read the documents from selected clusters, observe the corresponding images and locate them on a map.
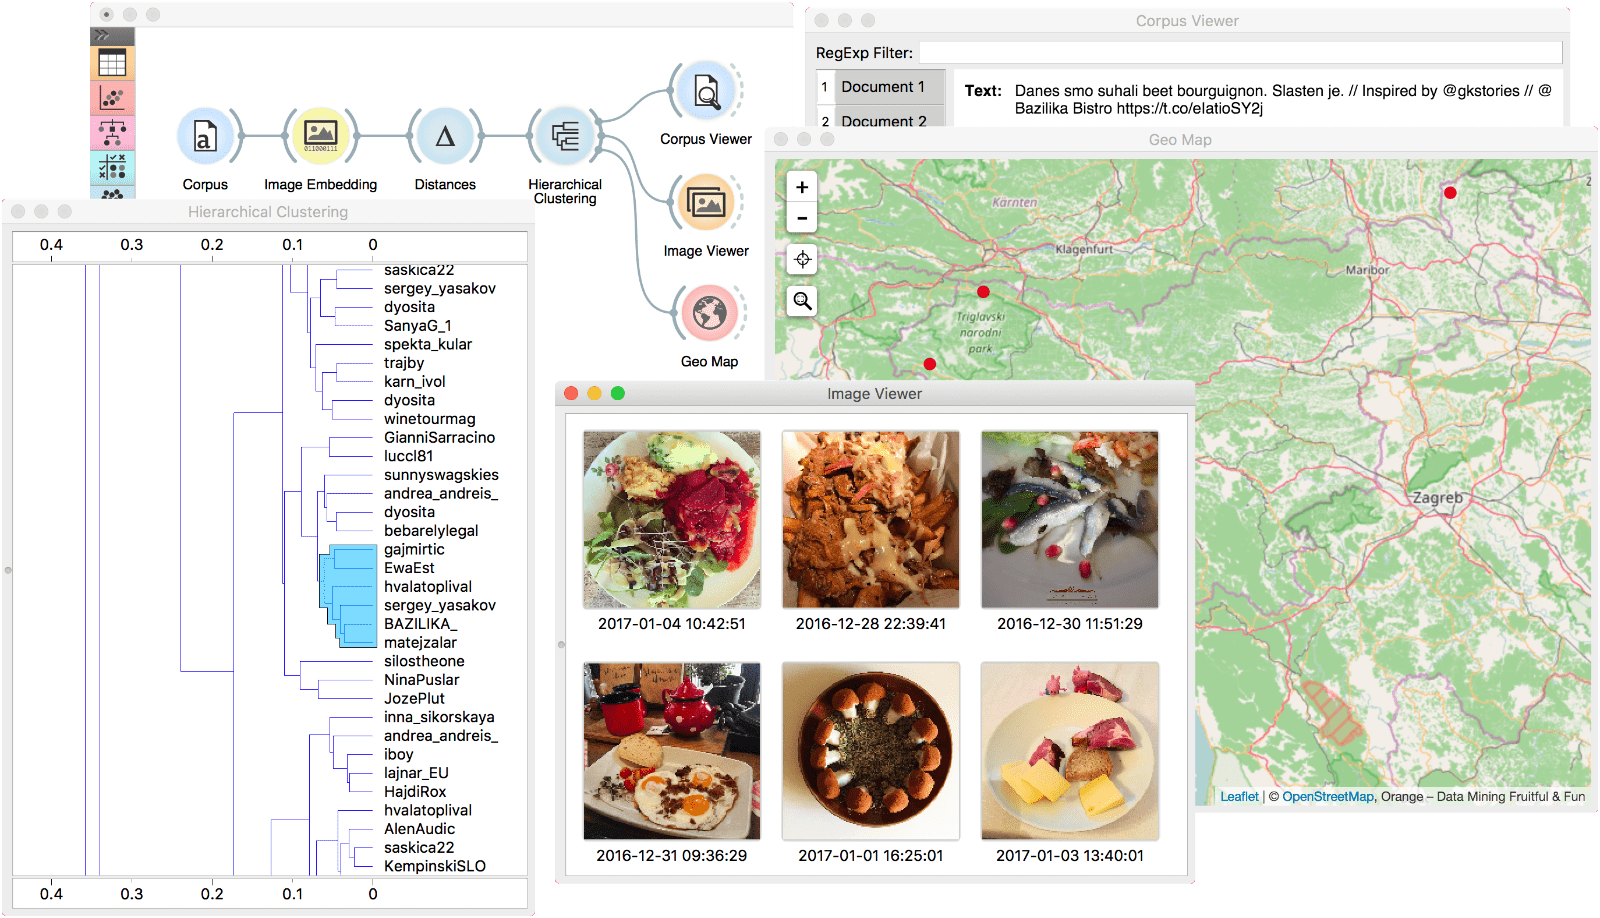 Hierarchical Clustering, Image Viewer, Geo Map and Corpus Viewer opened at the same time create an interactive data browser.
The workshop was a nice kick-off to an exciting week full of interesting lectures and presentations at Digital Humanities 2017 conference. So much to learn and see!