classification, interactive data visualization, orange3, regression, tree, visualization
The Beauty of Random Forest
BLAZ
Dec 22, 2016
It is the time of the year when we adore Christmas trees. But these are not the only trees we, at Orange team, think about. In fact, through almost life-long professional deformation of being a data scientist, when I think about trees I would often think about classification and regression trees. And they can be beautiful as well. Not only for their elegance in explaining the hidden patterns, but aesthetically, when rendered in Orange. And even more beautiful then a single tree is Orange's rendering of a forest, that is, a random forest.
Related: Pythagorean Trees and Forests
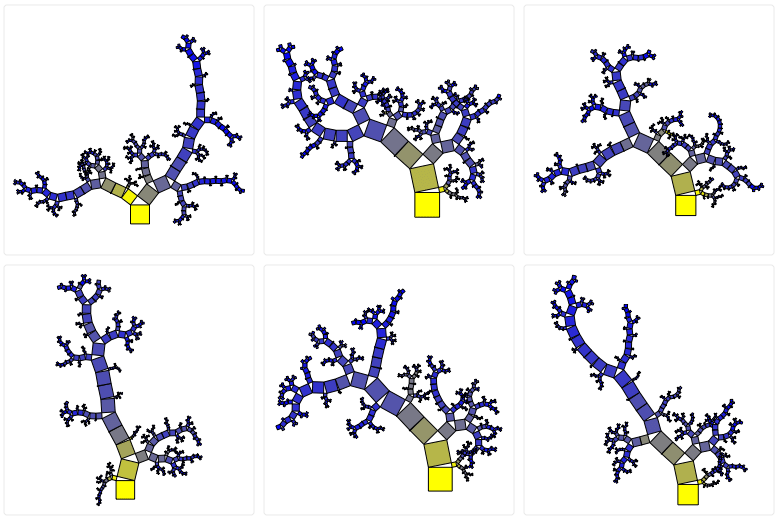
Here are six trees in the random forest constructed on the housing data set:
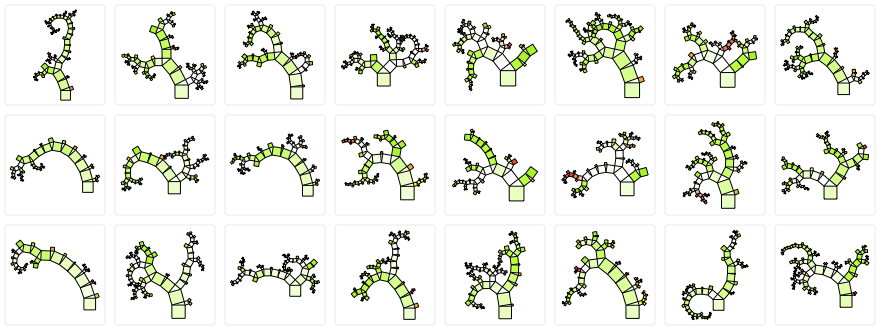
The random forest for annealing data set includes a set of smaller-sized trees:
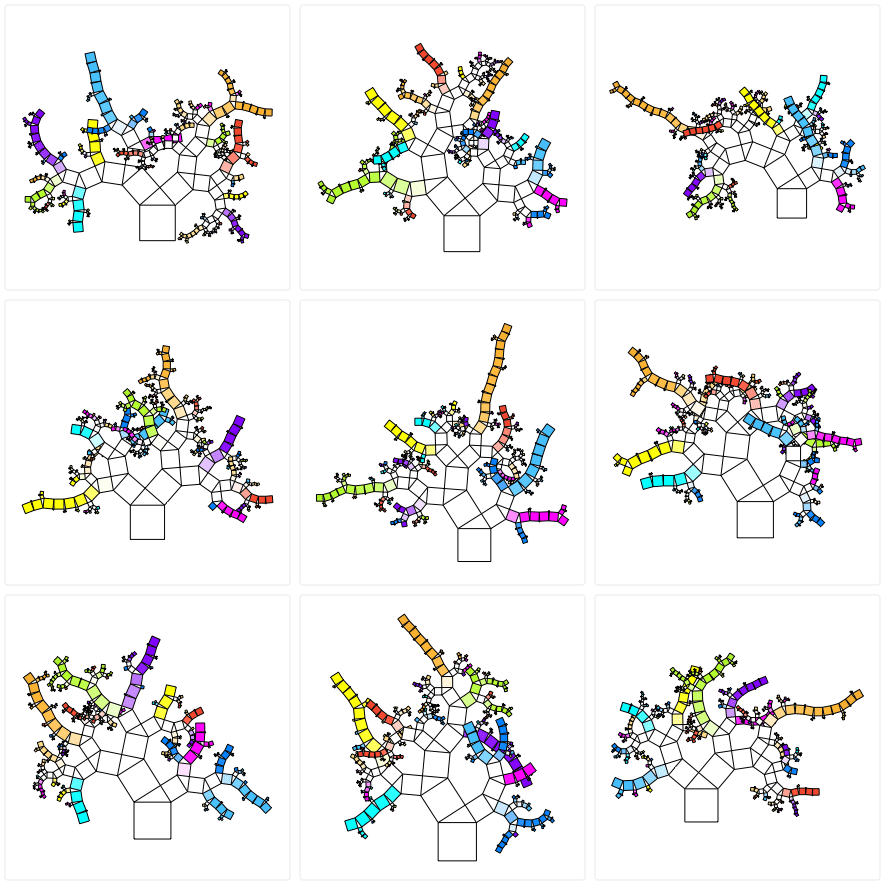
A Christmas-lit random forest inferred from pen digits data set looks somehow messy in trying to categorize to ten different classes:
The power of beauty! No wonder random forests are one of the best machine learning tools. Orange renders them according to the idea of Fabian Beck and colleagues who proposed Pythagoras trees for visualizations of hierarchies. The actual implementation for classification and regression trees for Orange was created by Pavlin Policar.