analysis, images, visualization
Save your graphs!
AJDA
Sep 25, 2015
If you are often working with Orange, you probably have noticed a small button at the bottom of most visualization widgets. “Save Graph” now enables you to export graphs, charts, and hierarchical trees to your computer and use them in your reports. Because people need to see it to believe it!
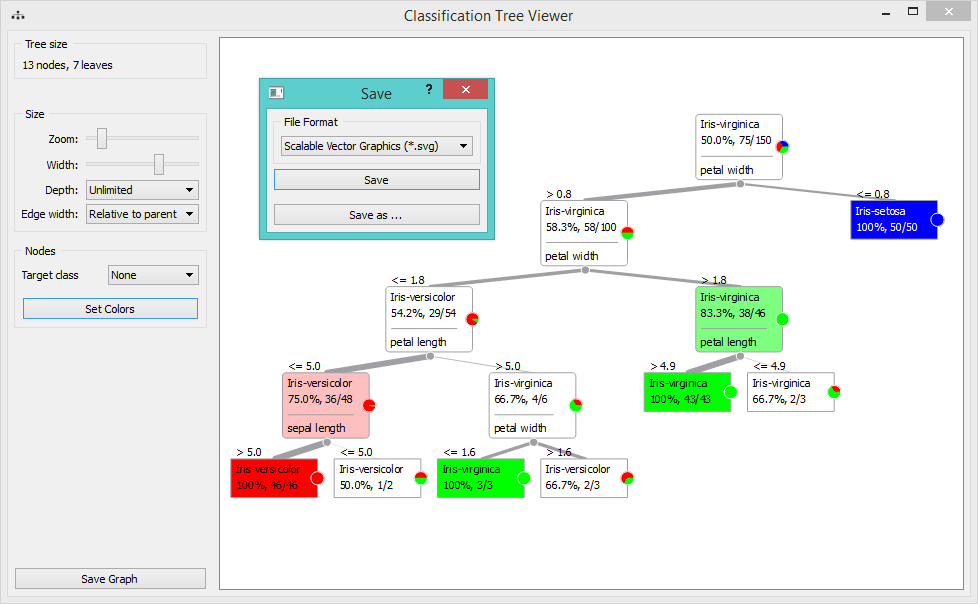
"Save Graph" will save visualizations to your computer.
Save Graph function is available in Paint Data, Image Viewer, all visualization widgets, and a few others (list is below).
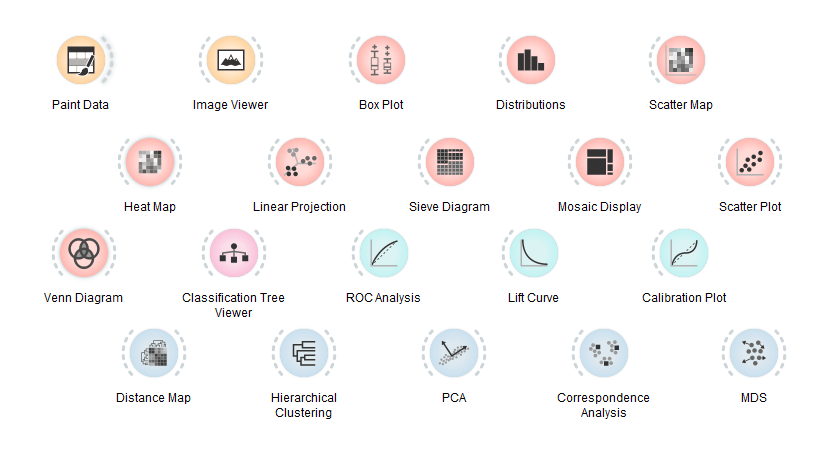
Widgets with the "Save Graph" option.
You can save visualizations in .png, .dot or .svg format. However - brace yourselves - our team is working on something even better, which will be announced in the following weeks.